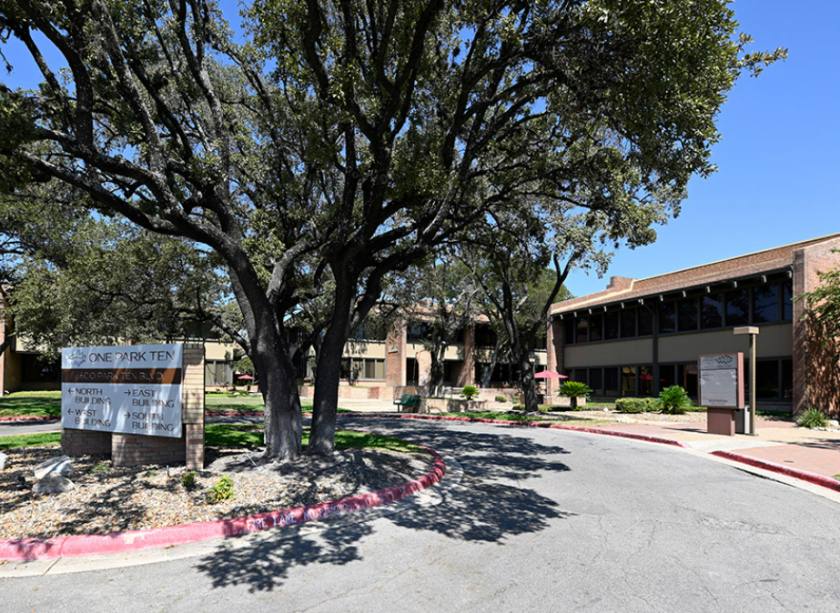
Office Space
6800 Park Ten Boulevard San Antonio, TX 78213
6800 Park Ten Boulevard San Antonio, TX 78213
Details & Description
Property Highlights
- • Full service cafe
- • Conveniently located at 410 and I-10 intersection
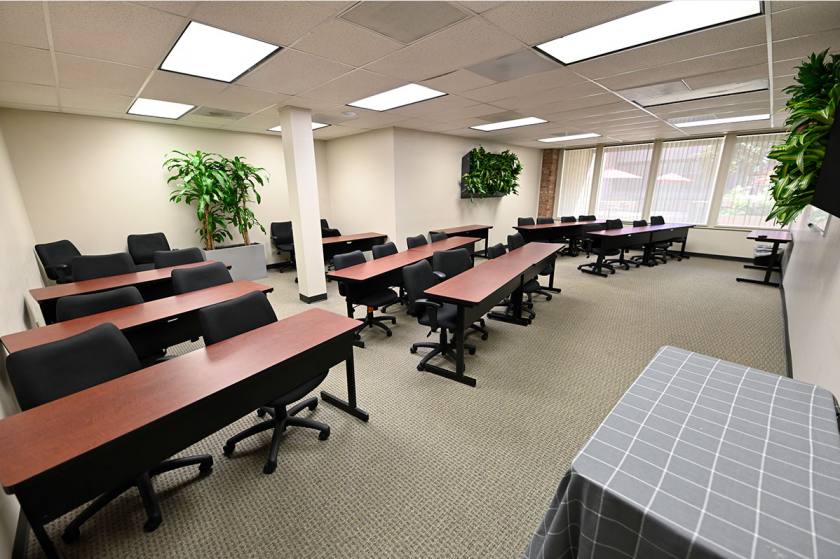
- • Conference rooms availabe
- • Move-in Ready space available
- • On-Site property management and maintenance staff
- • $21.00 PSF
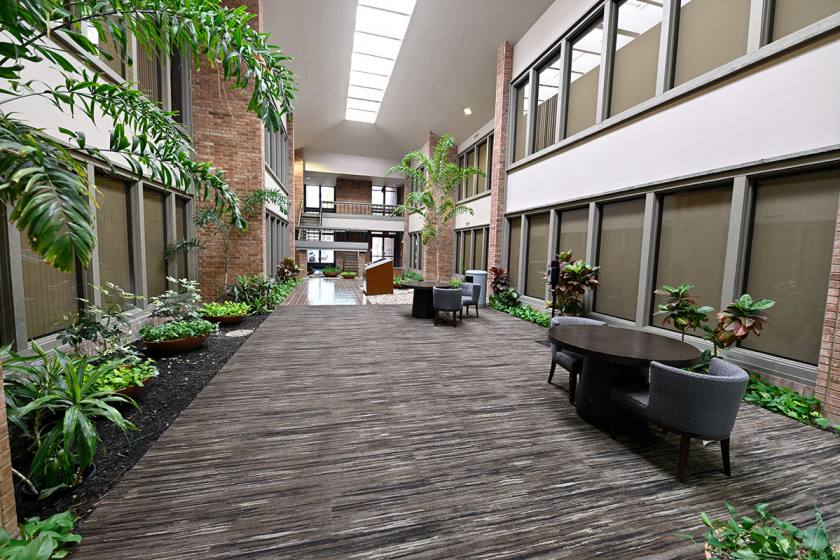
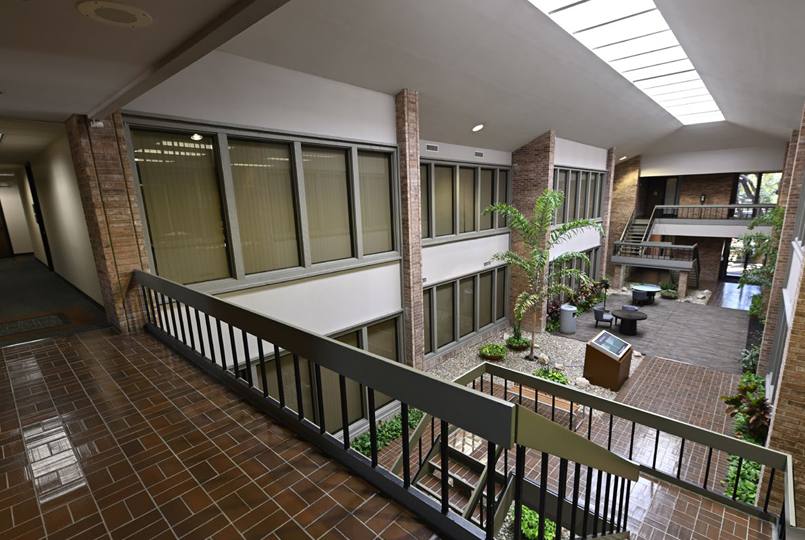
Additional Photos
Listing Agents

Andrew Lyles
O: 210-524-4000
M: 210-524-1306
alyles@reocsanantonio.com
O: 210-524-4000
M: 210-524-1306
alyles@reocsanantonio.com

Kimberly Gatley
O: 210-524-4000
M: 210-524-1320
kgatley@reocsanantonio.com
O: 210-524-4000
M: 210-524-1320
kgatley@reocsanantonio.com
While we strive to provide the most accurate information, all listing information, and demographic data, is provided by third-parties. As such, MyEListing will not be responsible for the accuracy of the information. It is strongly recommended that you verify all information with the listing agent, and any relevant agencies, prior to making any decisions.


