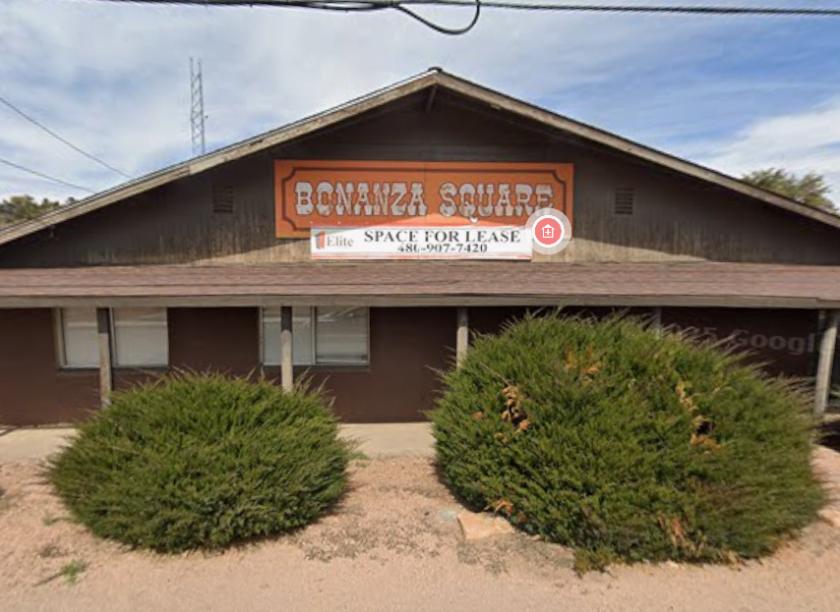
1-Mile | 3-Miles | 5-Miles | ||
---|---|---|---|---|
Total Population | 3,603 | 10,868 | 12,398 | |
Population Median Age | 49 | 53 | 53 | |
Population by Age | 0-9 Yrs | 210 (5%) | 643 (5%) | 788 (6%) |
10-19 Yrs | 373 (10%) | 790 (7%) | 906 (7%) | |
20-29 Yrs | 394 (10%) | 806 (7%) | 939 (7%) | |
30-39 Yrs | 452 (12%) | 983 (9%) | 1077 (8%) | |
40-49 Yrs | 273 (7%) | 782 (7%) | 891 (7%) | |
50-59 Yrs | 295 (8%) | 1268 (11%) | 1491 (12%) | |
60-69 Yrs | 673 (18%) | 2494 (22%) | 2859 (23%) | |
70+ Yrs | 932 (25%) | 3101 (28%) | 3448 (27%) | |
Median HH Income | $47,883 | $51,907 | $52,214 | |
Total Household Income | < 24K | 375 (22%) | 995 (19%) | 1156 (19%) |
25-49K | 475 (28%) | 1492 (28%) | 1650 (27%) | |
50-74K | 432 (26%) | 1296 (24%) | 1466 (24%) | |
75-99K | 121 (7%) | 647 (12%) | 708 (11%) | |
100-199K | 202 (12%) | 629 (12%) | 736 (12%) | |
200K+ | 34 (2%) | 153 (2%) | 198 (3%) | |
Highest Education Level | No Diploma | 275 | 764 | 834 |
Diploma or GED | 821 | 2514 | 2791 | |
Some College | 949 | 2930 | 3344 | |
Assoc. Degree | 362 | 911 | 994 | |
Bachelors Degree | 213 | 1127 | 1318 | |
Higher Degree | 257 | 842 | 992 | |
Total Housing Units | 1,889 | 6,464 | 7,499 | |
--Owner-Occupied | 1,009 | 3,744 | 4,330 | |
--Renter-Occupied | 630 | 1,469 | 1,585 | |
Owner-Occupied Values | < 100K | 147 | 414 | 544 |
100-199K | 285 | 1025 | 1104 | |
200-299K | 388 | 1292 | 1435 | |
300-399K | 126 | 639 | 692 | |
400-499K | 22 | 144 | 180 | |
500K+ | 41 | 231 | 374 | |
Total Working Age Population | 3,163 | 9,757 | 11,056 | |
In Work Force | 1,491 | 4,286 | 4,886 | |
Not In Work Force | 1,672 | 5,470 | 6,170 | |
Workforce Employed | 1,396 | 4,065 | 4,650 | |
Workforce Unemployed | 81 | 185 | 199 | |
Civlian Workforce | 1,476 | 4,249 | 4,849 | |
Military Workforce | 14 | 37 | 37 | |
Total Households | 1,639 | 5,213 | 5,914 | |
Family Households | 974 | 3,034 | 3,450 | |
Non-Family Households | 665 | 2,179 | 2,464 | |
Married Couple | 747 | 2,518 | 2,879 | |
Other Family | 226 | 516 | 571 | |
Married w/Child | 221 | 534 | 605 | |
Single Male w/Child | 1 | 1 | 3 | |
Single Female w/Child | 82 | 226 | 252 |
Population Change Last Two Decades - Plus Projection
2000 | % | 2010 | % | 2020 | % | 2030 | |
---|---|---|---|---|---|---|---|
Arizona | 5,130,632 | +25 | 6,392,017 | +14 | 7,286,100 | +14 | 8,284,900 |
Gila County | 51,335 | +4 | 53,597 | +3 | 55,100 | +1 | 55,400 |
Total Working Age Population:
Total Households:
Total Working Age Population:
Total Households:
Total Working Age Population:
Total Households: