Office Space
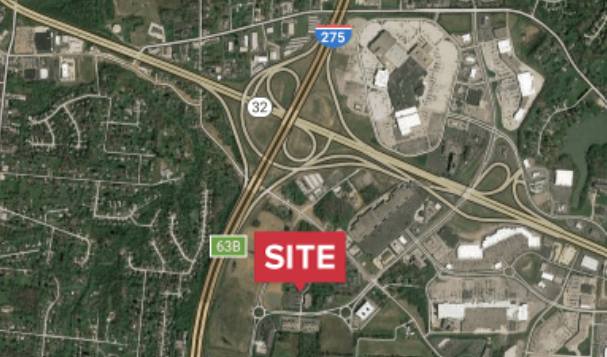
4435 Aicholtz Road Cincinnati, OH 45245
4435 Aicholtz Road Cincinnati, OH 45245

Details & Description
Property Highlights
- • Ample Parking
- • Easy Access to OH-32 and I-275
- • Suites with Drive-Ins Available
- • Ceiling Heights 8’-14’
- • Only Three Suites Left
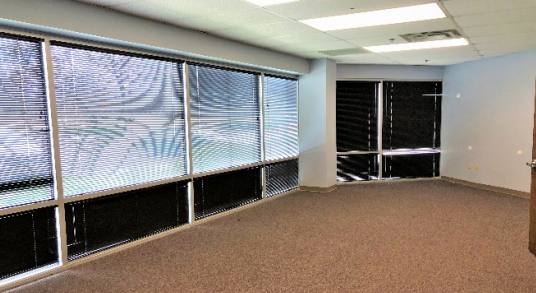
Additional Photos


Listing Agents

Gueorgui Chikov
O: 513-322-6317
M: 513-331-0920
gchikov@bergmancommercial.com
O: 513-322-6317
M: 513-331-0920
gchikov@bergmancommercial.com
While we strive to provide the most accurate information, all listing information, and demographic data, is provided by third-parties. As such, MyEListing will not be responsible for the accuracy of the information. It is strongly recommended that you verify all information with the listing agent, and any relevant agencies, prior to making any decisions.


