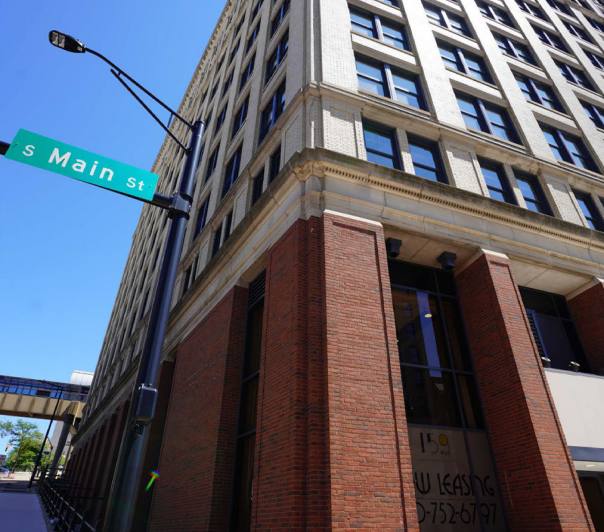
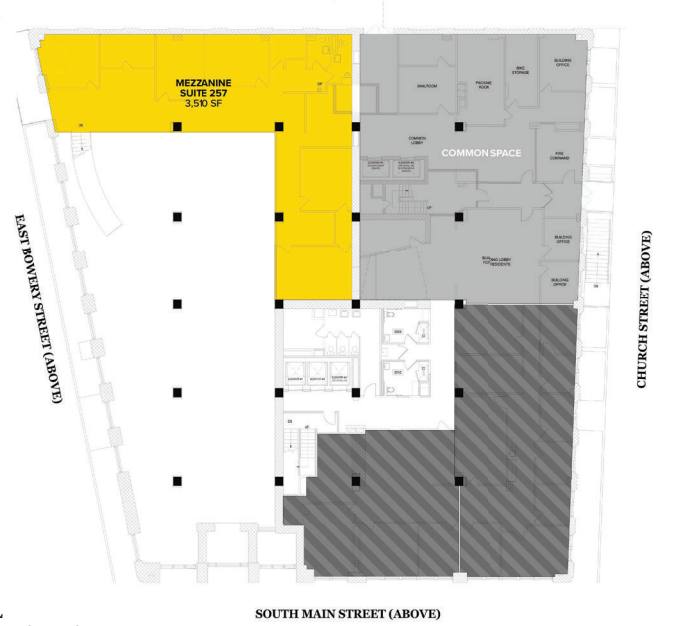
1-Mile | 3-Miles | 5-Miles | ||
---|---|---|---|---|
Total Population | 10,246 | 115,551 | 235,321 | |
Population Median Age | 31 | 37 | 39 | |
Population by Age | 0-9 Yrs | 485 (4%) | 14822 (12%) | 28183 (11%) |
10-19 Yrs | 2278 (22%) | 14468 (12%) | 27346 (11%) | |
20-29 Yrs | 3956 (38%) | 21213 (18%) | 39290 (16%) | |
30-39 Yrs | 886 (8%) | 13901 (12%) | 30836 (13%) | |
40-49 Yrs | 823 (8%) | 13308 (11%) | 27237 (11%) | |
50-59 Yrs | 764 (7%) | 14276 (12%) | 30395 (12%) | |
60-69 Yrs | 630 (6%) | 12995 (11%) | 28351 (12%) | |
70+ Yrs | 423 (4%) | 10566 (9%) | 23684 (10%) | |
Median HH Income | $19,017 | $35,203 | $43,119 | |
Total Household Income | < 24K | 1843 (56%) | 17561 (36%) | 29728 (28%) |
25-49K | 830 (25%) | 13688 (28%) | 28220 (27%) | |
50-74K | 325 (9%) | 7794 (16%) | 19006 (18%) | |
75-99K | 124 (3%) | 4619 (9%) | 12278 (11%) | |
100-199K | 122 (3%) | 4065 (8%) | 11863 (11%) | |
200K+ | 25 (0%) | 622 (1%) | 1681 (1%) | |
Highest Education Level | No Diploma | 740 | 11128 | 18500 |
Diploma or GED | 1351 | 25740 | 53525 | |
Some College | 1087 | 18195 | 37628 | |
Assoc. Degree | 278 | 5978 | 14080 | |
Bachelors Degree | 543 | 9106 | 24670 | |
Higher Degree | 374 | 4966 | 12661 | |
Total Housing Units | 4,054 | 55,664 | 114,532 | |
--Owner-Occupied | 524 | 21,806 | 53,864 | |
--Renter-Occupied | 2,745 | 26,543 | 48,911 | |
Owner-Occupied Values | < 100K | 423 | 16668 | 29812 |
100-199K | 68 | 3753 | 19077 | |
200-299K | 15 | 759 | 3362 | |
300-399K | 4 | 243 | 743 | |
400-499K | 0 | 84 | 288 | |
500K+ | 13 | 300 | 582 | |
Total Working Age Population | 9,472 | 93,647 | 191,893 | |
In Work Force | 4,888 | 57,692 | 123,656 | |
Not In Work Force | 4,584 | 35,955 | 68,237 | |
Workforce Employed | 4,386 | 51,508 | 113,699 | |
Workforce Unemployed | 502 | 6,097 | 9,782 | |
Civlian Workforce | 4,888 | 57,606 | 123,481 | |
Military Workforce | 0 | 86 | 175 | |
Total Households | 3,269 | 48,349 | 102,775 | |
Family Households | 862 | 25,111 | 54,869 | |
Non-Family Households | 2,407 | 23,238 | 47,906 | |
Married Couple | 302 | 12,729 | 32,296 | |
Other Family | 560 | 12,382 | 22,573 | |
Married w/Child | 99 | 3,922 | 10,467 | |
Single Male w/Child | 51 | 1,313 | 2,700 | |
Single Female w/Child | 317 | 5,994 | 9,839 |
Population Change Last Two Decades - Plus Projection
2000 | % | 2010 | % | 2020 | % | 2030 | |
---|---|---|---|---|---|---|---|
Ohio | 11,353,140 | +2 | 11,536,504 | 0 | 11,574,870 | 0 | 11,615,100 |
Summit County | 542,899 | 0 | 541,781 | -1 | 534,150 | -1 | 528,990 |
Total Working Age Population:
Total Households:
Total Working Age Population:
Total Households:
Total Working Age Population:
Total Households: