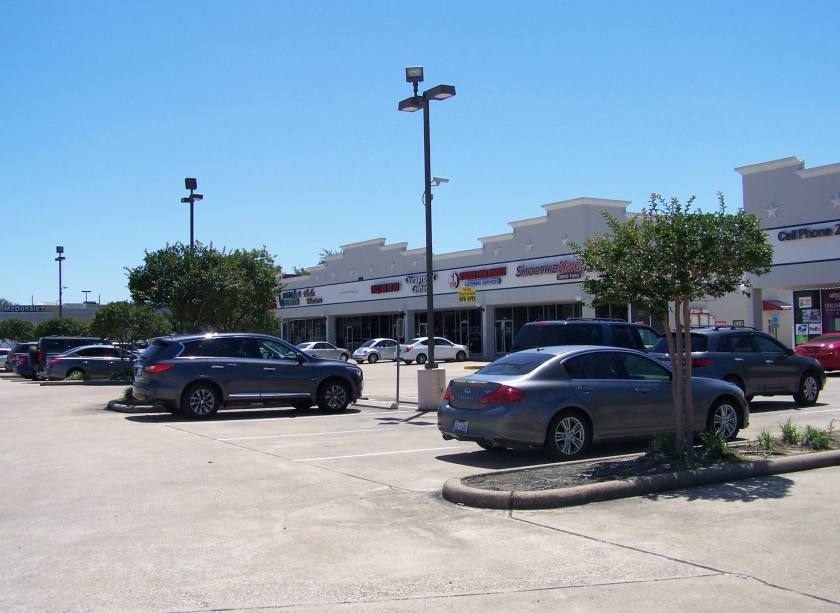
1-Mile | 3-Miles | 5-Miles | ||
---|---|---|---|---|
Total Population | 18,897 | 170,681 | 361,170 | |
Population Median Age | 36 | 36 | 36 | |
Population by Age | 0-9 Yrs | 2830 (14%) | 21965 (12%) | 48397 (13%) |
10-19 Yrs | 2496 (13%) | 27171 (15%) | 52572 (14%) | |
20-29 Yrs | 3134 (16%) | 27202 (15%) | 57769 (15%) | |
30-39 Yrs | 1986 (10%) | 20724 (12%) | 50547 (13%) | |
40-49 Yrs | 2512 (13%) | 23532 (13%) | 48419 (13%) | |
50-59 Yrs | 2278 (12%) | 22166 (12%) | 44819 (12%) | |
60-69 Yrs | 2356 (12%) | 16869 (9%) | 35512 (9%) | |
70+ Yrs | 1305 (6%) | 11053 (6%) | 23135 (6%) | |
Median HH Income | $77,997 | $61,179 | $59,790 | |
Total Household Income | < 24K | 593 (10%) | 7658 (15%) | 20041 (17%) |
25-49K | 1192 (21%) | 12242 (24%) | 27949 (24%) | |
50-74K | 857 (15%) | 9742 (19%) | 21410 (18%) | |
75-99K | 1010 (18%) | 7650 (15%) | 15108 (13%) | |
100-199K | 1461 (26%) | 10395 (20%) | 23724 (20%) | |
200K+ | 414 (7%) | 2393 (4%) | 6946 (6%) | |
Highest Education Level | No Diploma | 1612 | 21220 | 43085 |
Diploma or GED | 2868 | 27023 | 55381 | |
Some College | 2819 | 23180 | 45852 | |
Assoc. Degree | 988 | 8490 | 17622 | |
Bachelors Degree | 2387 | 18002 | 46324 | |
Higher Degree | 1401 | 9709 | 24062 | |
Total Housing Units | 5,652 | 52,834 | 123,452 | |
--Owner-Occupied | 3,903 | 32,015 | 64,141 | |
--Renter-Occupied | 1,624 | 18,064 | 51,037 | |
Owner-Occupied Values | < 100K | 392 | 3836 | 7409 |
100-199K | 2058 | 17848 | 30707 | |
200-299K | 1272 | 7419 | 15443 | |
300-399K | 142 | 1898 | 5597 | |
400-499K | 17 | 282 | 1757 | |
500K+ | 22 | 731 | 3227 | |
Total Working Age Population | 14,760 | 131,757 | 280,084 | |
In Work Force | 10,226 | 89,556 | 190,964 | |
Not In Work Force | 4,534 | 42,200 | 89,120 | |
Workforce Employed | 9,576 | 83,955 | 179,190 | |
Workforce Unemployed | 650 | 5,592 | 11,491 | |
Civlian Workforce | 10,226 | 89,548 | 190,680 | |
Military Workforce | 0 | 9 | 284 | |
Total Households | 5,527 | 50,080 | 115,178 | |
Family Households | 4,326 | 40,276 | 86,499 | |
Non-Family Households | 1,202 | 9,804 | 28,679 | |
Married Couple | 3,159 | 29,255 | 60,536 | |
Other Family | 1,167 | 11,021 | 25,962 | |
Married w/Child | 1,394 | 13,629 | 27,751 | |
Single Male w/Child | 200 | 1,305 | 2,534 | |
Single Female w/Child | 479 | 4,172 | 10,767 |
Population Change Last Two Decades - Plus Projection
2000 | % | 2010 | % | 2020 | % | 2030 | |
---|---|---|---|---|---|---|---|
Texas | 20,851,820 | +21 | 25,145,561 | +18 | 29,677,668 | +18 | 34,894,452 |
Fort Bend County | 354,452 | +65 | 585,375 | +44 | 840,383 | +43 | 1,203,029 |
Harris County | 3,400,578 | +20 | 4,092,459 | +22 | 4,978,845 | +19 | 5,924,750 |
Total Working Age Population:
Total Households:
Total Working Age Population:
Total Households:
Total Working Age Population:
Total Households: