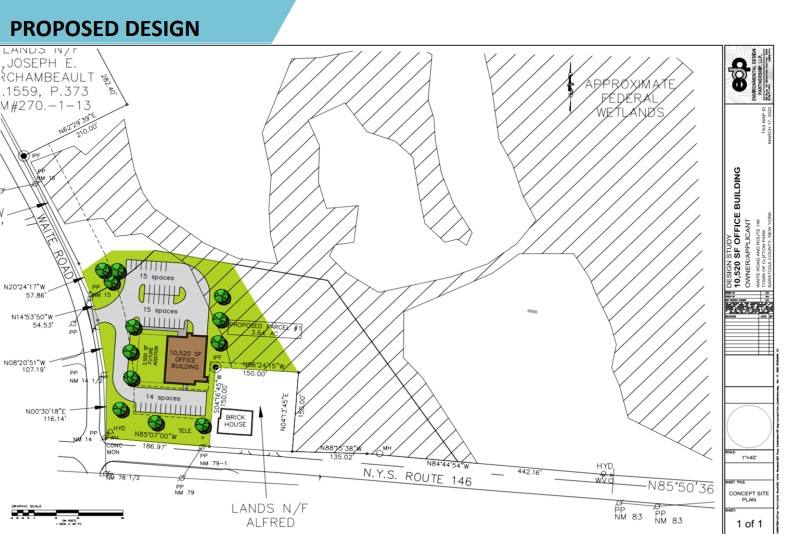
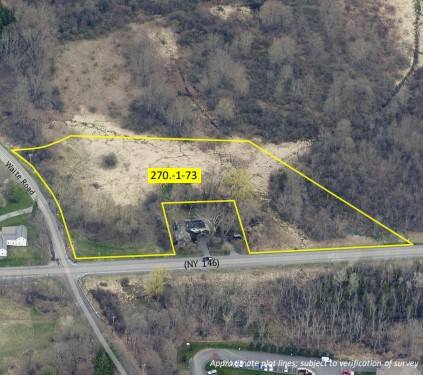
1-Mile | 3-Miles | 5-Miles | ||
---|---|---|---|---|
Total Population | 1,024 | 16,846 | 74,676 | |
Population Median Age | 41 | 40 | 41 | |
Population by Age | 0-9 Yrs | 136 (13%) | 2084 (12%) | 9122 (12%) |
10-19 Yrs | 105 (10%) | 2516 (14%) | 9233 (12%) | |
20-29 Yrs | 89 (8%) | 1487 (8%) | 8036 (10%) | |
30-39 Yrs | 151 (14%) | 1879 (11%) | 9061 (12%) | |
40-49 Yrs | 140 (13%) | 2130 (12%) | 8951 (11%) | |
50-59 Yrs | 164 (16%) | 2874 (17%) | 10945 (14%) | |
60-69 Yrs | 114 (11%) | 1952 (11%) | 9770 (13%) | |
70+ Yrs | 125 (12%) | 1924 (11%) | 9559 (12%) | |
Median HH Income | $133,466 | $122,516 | $96,397 | |
Total Household Income | < 24K | 21 (5%) | 358 (5%) | 2623 (8%) |
25-49K | 43 (10%) | 642 (10%) | 4170 (14%) | |
50-74K | 23 (5%) | 690 (11%) | 4703 (15%) | |
75-99K | 35 (8%) | 682 (10%) | 3788 (12%) | |
100-199K | 176 (43%) | 2401 (38%) | 10106 (34%) | |
200K+ | 106 (26%) | 1441 (23%) | 4087 (13%) | |
Highest Education Level | No Diploma | 30 | 287 | 2185 |
Diploma or GED | 100 | 1694 | 8936 | |
Some College | 109 | 1447 | 7494 | |
Assoc. Degree | 52 | 1416 | 6524 | |
Bachelors Degree | 225 | 3542 | 13664 | |
Higher Degree | 241 | 3141 | 13852 | |
Total Housing Units | 423 | 6,560 | 32,576 | |
--Owner-Occupied | 341 | 5,319 | 21,473 | |
--Renter-Occupied | 62 | 894 | 8,004 | |
Owner-Occupied Values | < 100K | 2 | 131 | 1071 |
100-199K | 33 | 560 | 4216 | |
200-299K | 48 | 1765 | 7410 | |
300-399K | 140 | 1727 | 5153 | |
400-499K | 85 | 688 | 2008 | |
500K+ | 33 | 448 | 1614 | |
Total Working Age Population | 839 | 13,313 | 59,728 | |
In Work Force | 562 | 8,974 | 39,219 | |
Not In Work Force | 278 | 4,339 | 20,509 | |
Workforce Employed | 544 | 8,736 | 37,613 | |
Workforce Unemployed | 18 | 234 | 1,522 | |
Civlian Workforce | 562 | 8,970 | 39,135 | |
Military Workforce | 0 | 3 | 84 | |
Total Households | 403 | 6,213 | 29,478 | |
Family Households | 311 | 4,698 | 19,761 | |
Non-Family Households | 92 | 1,515 | 9,716 | |
Married Couple | 278 | 4,104 | 16,172 | |
Other Family | 33 | 595 | 3,590 | |
Married w/Child | 137 | 1,857 | 6,657 | |
Single Male w/Child | 2 | 52 | 462 | |
Single Female w/Child | 13 | 229 | 1,383 |
Population Change Last Two Decades - Plus Projection
2000 | % | 2010 | % | 2020 | % | 2030 | |
---|---|---|---|---|---|---|---|
New York | 18,976,457 | +2 | 19,378,102 | +4 | 20,146,131 | +2 | 20,604,030 |
Saratoga County | 200,635 | +9 | 219,607 | +7 | 234,009 | +5 | 246,743 |
Schenectady County | 146,555 | +6 | 154,727 | +1 | 156,103 | +1 | 157,575 |
Total Working Age Population:
Total Households:
Total Working Age Population:
Total Households:
Total Working Age Population:
Total Households: