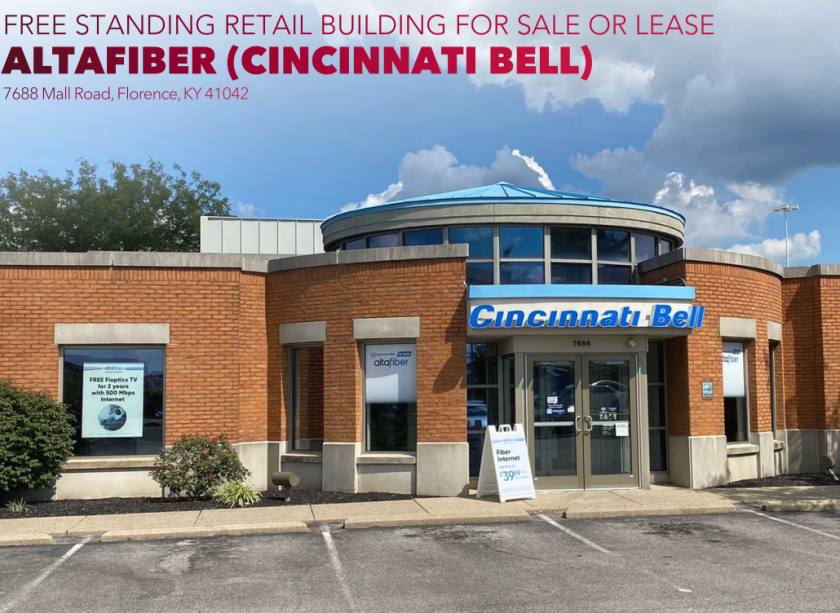
Retail Space
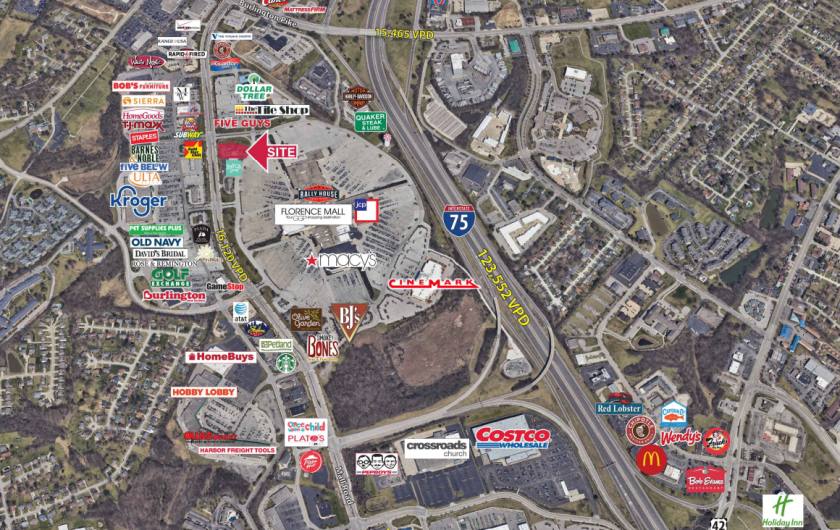
7688 Mall Road Florence, KY 41042
7688 Mall Road Florence, KY 41042
Details & Description
Property Highlights
- • ALTAFIBER lease ends 3/2024
- • Corner Traffic light
- • Dedicated Turn Lane
- • 692’ of Frontage on Mall Road
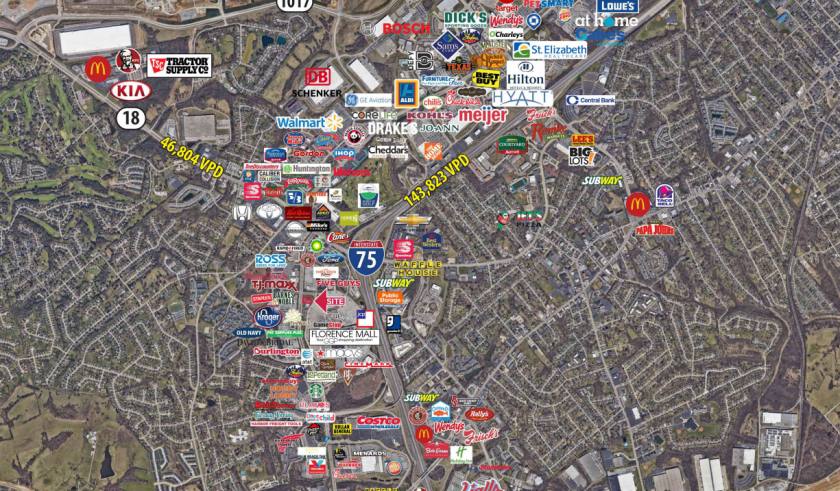
- • 2 minutes to I-75
Listing Agents

TC Bartoszek
O: 513-588-1840
M: 513-535-0563
tcbartoszek@lee-associates.com
O: 513-588-1840
M: 513-535-0563
tcbartoszek@lee-associates.com
While we strive to provide the most accurate information, all listing information, and demographic data, is provided by third-parties. As such, MyEListing will not be responsible for the accuracy of the information. It is strongly recommended that you verify all information with the listing agent, and any relevant agencies, prior to making any decisions.