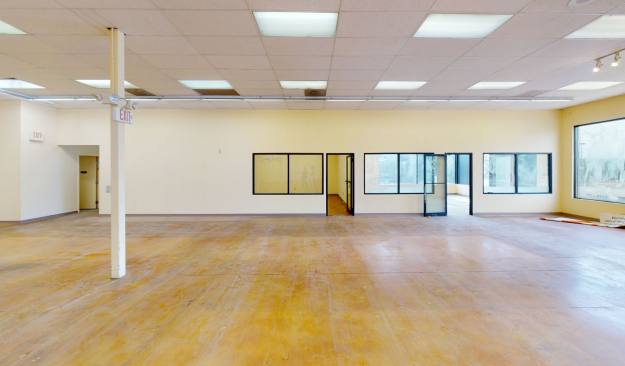
Retail Space
7341 Tylers Corners Drive Wetherington, OH 45069
7341 Tylers Corners Drive Wetherington, OH 45069

Details & Description
Property Highlights
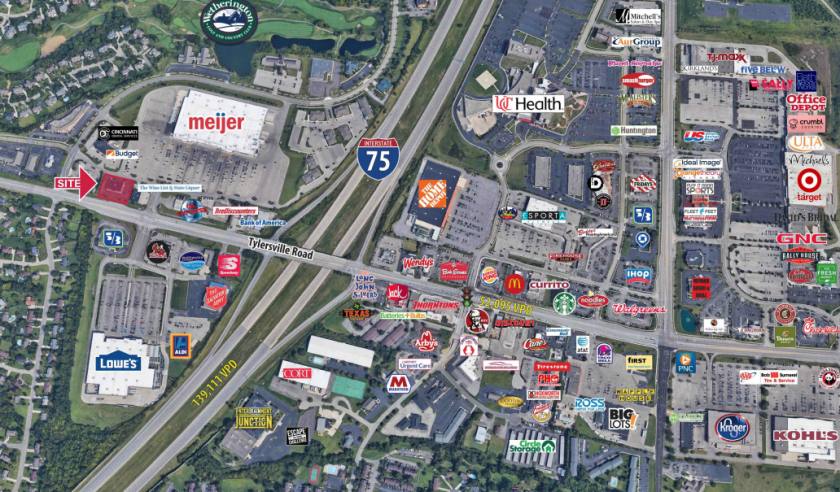
- • Outparcel of a Meijer superstore
- • Fantastic visibility to Tylersville Rd
- • Quarter mile to Highway 75
- • Zoned B-2
- • Attractive high-end growth market
- • Tax: $2.86 PSF
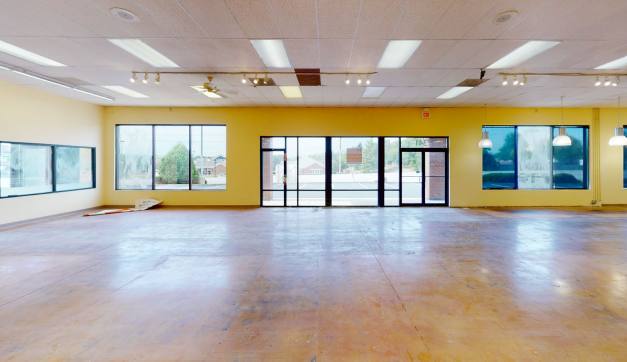
Additional Photos


Listing Agents

TC Bartoszek
O: 513-588-1840
M: 513-535-0563
tcbartoszek@lee-associates.com
O: 513-588-1840
M: 513-535-0563
tcbartoszek@lee-associates.com

Molly Hoffman
O: 513-588-1843
mhoffman@lee-associates.com
O: 513-588-1843
mhoffman@lee-associates.com

Chris Nachtrab
O: 513-588-1841
M: 513-604-1899
cnachtrab@lee-associates.com
O: 513-588-1841
M: 513-604-1899
cnachtrab@lee-associates.com
While we strive to provide the most accurate information, all listing information, and demographic data, is provided by third-parties. As such, MyEListing will not be responsible for the accuracy of the information. It is strongly recommended that you verify all information with the listing agent, and any relevant agencies, prior to making any decisions.