Retail Space
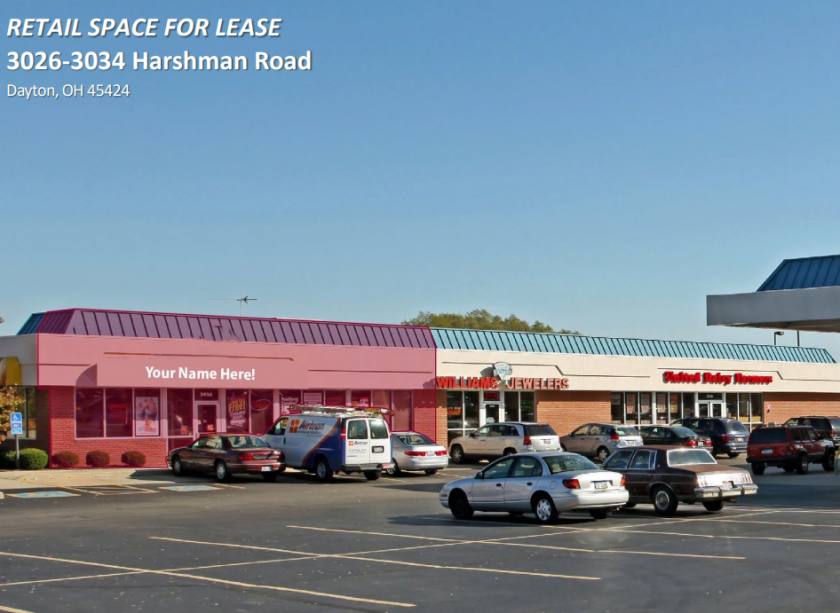
3026 Harshman Road Dayton, OH 45424
3026 Harshman Road Dayton, OH 45424
Details & Description
Property Highlights
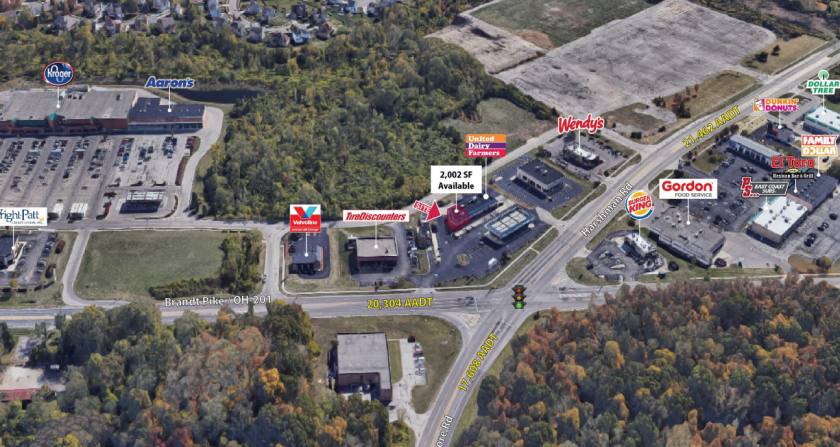
• Located in strong retail corridor with Burger King, Wendy’s, Penn Station, Dunkin’ Doughnuts, and Kroger ne
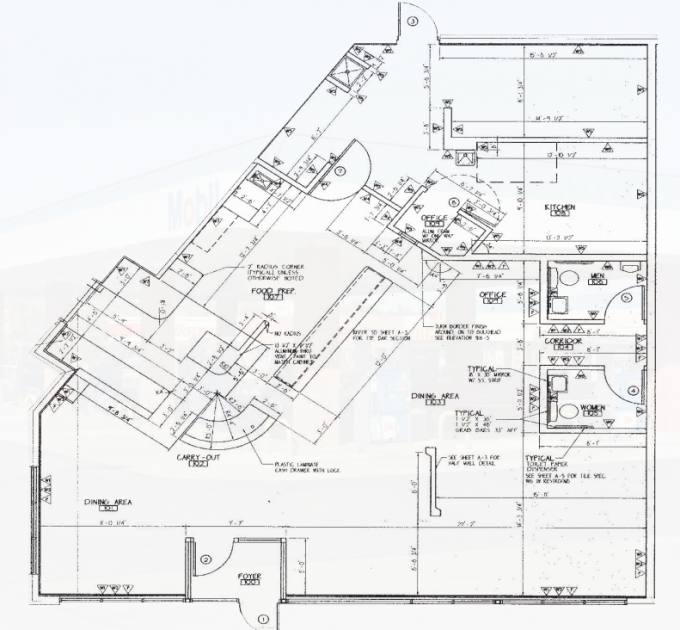
• Former Gold Star Chili restaurant connected to United Dairy Farmers Retail Center
Listing Agents

Stewart Devitt
O: 513-588-1115
stewart.devitt@lee-associates.com
O: 513-588-1115
stewart.devitt@lee-associates.com

Dan McDonald
O: 513-588-1113
M: 513-608-2984
dan.mcdonald@lee-associates.com
O: 513-588-1113
M: 513-608-2984
dan.mcdonald@lee-associates.com
While we strive to provide the most accurate information, all listing information, and demographic data, is provided by third-parties. As such, MyEListing will not be responsible for the accuracy of the information. It is strongly recommended that you verify all information with the listing agent, and any relevant agencies, prior to making any decisions.