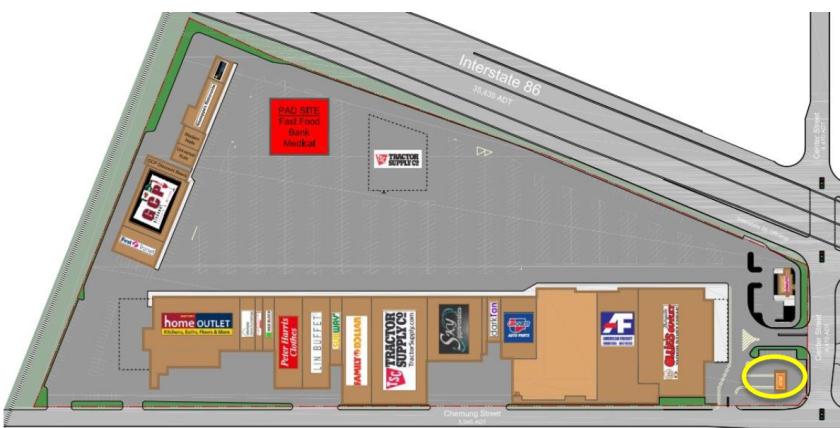
1-Mile | 3-Miles | 5-Miles | ||
---|---|---|---|---|
Total Population | 3,910 | 19,889 | 42,475 | |
Population Median Age | 43 | 43 | 41 | |
Population by Age | 0-9 Yrs | 322 (8%) | 1714 (8%) | 4369 (10%) |
10-19 Yrs | 427 (10%) | 2443 (12%) | 5588 (13%) | |
20-29 Yrs | 632 (16%) | 2614 (13%) | 5522 (13%) | |
30-39 Yrs | 422 (10%) | 1949 (9%) | 5016 (11%) | |
40-49 Yrs | 387 (9%) | 2418 (12%) | 4917 (11%) | |
50-59 Yrs | 615 (15%) | 3155 (15%) | 6395 (15%) | |
60-69 Yrs | 554 (14%) | 2507 (12%) | 5168 (12%) | |
70+ Yrs | 552 (14%) | 3089 (15%) | 5501 (12%) | |
Median HH Income | $48,400 | $55,852 | $52,340 | |
Total Household Income | < 24K | 354 (17%) | 1578 (18%) | 3833 (22%) |
25-49K | 694 (34%) | 2312 (26%) | 4414 (25%) | |
50-74K | 431 (21%) | 1658 (19%) | 3164 (18%) | |
75-99K | 250 (12%) | 1270 (14%) | 2142 (12%) | |
100-199K | 231 (11%) | 1535 (17%) | 2895 (16%) | |
200K+ | 34 (1%) | 368 (4%) | 718 (4%) | |
Highest Education Level | No Diploma | 208 | 1075 | 3295 |
Diploma or GED | 1059 | 5008 | 9824 | |
Some College | 390 | 2745 | 5458 | |
Assoc. Degree | 435 | 1890 | 3560 | |
Bachelors Degree | 394 | 2110 | 4095 | |
Higher Degree | 300 | 1654 | 3419 | |
Total Housing Units | 2,118 | 9,486 | 19,420 | |
--Owner-Occupied | 1,093 | 5,254 | 10,527 | |
--Renter-Occupied | 902 | 3,468 | 6,639 | |
Owner-Occupied Values | < 100K | 525 | 1932 | 4428 |
100-199K | 501 | 2323 | 4093 | |
200-299K | 32 | 598 | 1179 | |
300-399K | 25 | 202 | 469 | |
400-499K | 1 | 100 | 186 | |
500K+ | 9 | 100 | 173 | |
Total Working Age Population | 3,364 | 16,704 | 34,686 | |
In Work Force | 2,126 | 9,959 | 19,025 | |
Not In Work Force | 1,239 | 6,744 | 15,661 | |
Workforce Employed | 2,010 | 9,462 | 17,827 | |
Workforce Unemployed | 111 | 471 | 1,172 | |
Civlian Workforce | 2,121 | 9,933 | 18,999 | |
Military Workforce | 4 | 26 | 26 | |
Total Households | 1,995 | 8,722 | 17,166 | |
Family Households | 956 | 4,927 | 10,096 | |
Non-Family Households | 1,039 | 3,796 | 7,070 | |
Married Couple | 655 | 3,502 | 6,961 | |
Other Family | 301 | 1,425 | 3,134 | |
Married w/Child | 180 | 1,081 | 2,396 | |
Single Male w/Child | 5 | 180 | 429 | |
Single Female w/Child | 154 | 660 | 1,551 |
Population Change Last Two Decades - Plus Projection
2000 | % | 2010 | % | 2020 | % | 2030 | |
---|---|---|---|---|---|---|---|
New York | 18,976,457 | +2 | 19,378,102 | +4 | 20,146,131 | +2 | 20,604,030 |
Chemung County | 91,070 | -2 | 88,830 | -4 | 85,213 | -4 | 81,922 |
Total Working Age Population:
Total Households:
Total Working Age Population:
Total Households:
Total Working Age Population:
Total Households: