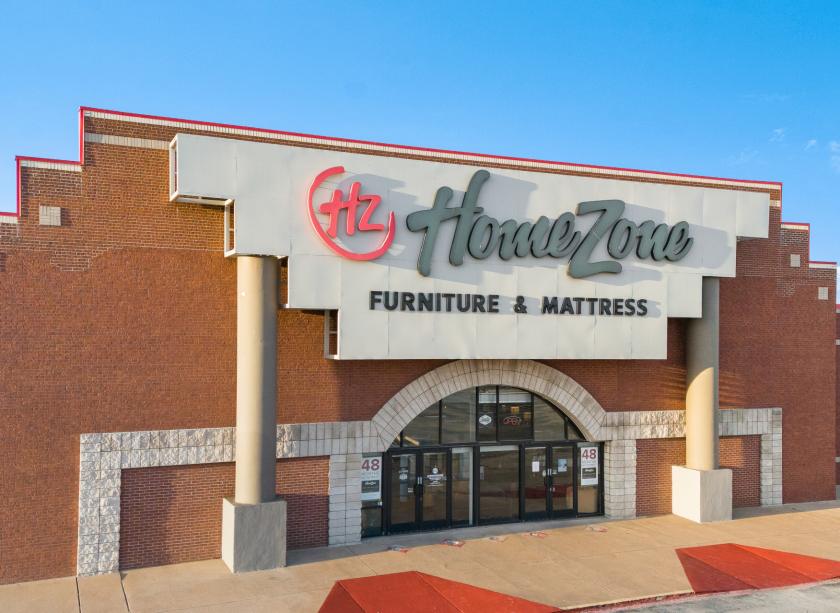
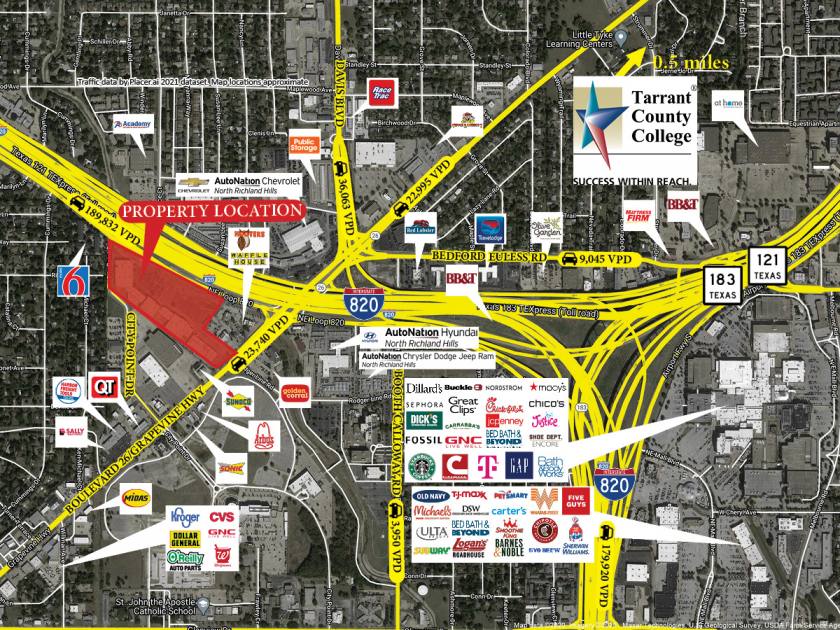
1-Mile | 3-Miles | 5-Miles | ||
---|---|---|---|---|
Total Population | 10,182 | 102,860 | 277,259 | |
Population Median Age | 39 | 38 | 37 | |
Population by Age | 0-9 Yrs | 1236 (12%) | 12471 (12%) | 37156 (13%) |
10-19 Yrs | 1057 (10%) | 13573 (13%) | 38353 (13%) | |
20-29 Yrs | 1628 (15%) | 14736 (14%) | 37878 (13%) | |
30-39 Yrs | 1520 (14%) | 14157 (13%) | 37795 (13%) | |
40-49 Yrs | 1140 (11%) | 13138 (12%) | 36097 (13%) | |
50-59 Yrs | 1404 (13%) | 12370 (12%) | 34800 (12%) | |
60-69 Yrs | 1097 (10%) | 11723 (11%) | 31041 (11%) | |
70+ Yrs | 1101 (10%) | 10690 (10%) | 24140 (8%) | |
Median HH Income | $59,545 | $64,379 | $68,512 | |
Total Household Income | < 24K | 437 (11%) | 4903 (12%) | 12874 (12%) |
25-49K | 1117 (30%) | 9326 (24%) | 22390 (22%) | |
50-74K | 654 (17%) | 8162 (21%) | 19337 (19%) | |
75-99K | 521 (14%) | 5897 (15%) | 14486 (14%) | |
100-199K | 897 (24%) | 8646 (22%) | 25072 (25%) | |
200K+ | 65 (1%) | 1620 (4%) | 5833 (5%) | |
Highest Education Level | No Diploma | 790 | 7592 | 21392 |
Diploma or GED | 2017 | 19600 | 46875 | |
Some College | 1875 | 17774 | 45526 | |
Assoc. Degree | 769 | 6396 | 16352 | |
Bachelors Degree | 1236 | 13235 | 38144 | |
Higher Degree | 480 | 5817 | 16131 | |
Total Housing Units | 4,054 | 41,105 | 106,699 | |
--Owner-Occupied | 2,411 | 22,942 | 62,122 | |
--Renter-Occupied | 1,281 | 15,612 | 37,871 | |
Owner-Occupied Values | < 100K | 257 | 2568 | 6468 |
100-199K | 1274 | 10946 | 24780 | |
200-299K | 757 | 6528 | 18432 | |
300-399K | 82 | 1909 | 6886 | |
400-499K | 0 | 636 | 3631 | |
500K+ | 40 | 355 | 1925 | |
Total Working Age Population | 8,310 | 81,231 | 215,881 | |
In Work Force | 5,879 | 55,857 | 149,073 | |
Not In Work Force | 2,431 | 25,374 | 66,808 | |
Workforce Employed | 5,562 | 53,802 | 142,801 | |
Workforce Unemployed | 317 | 2,025 | 6,156 | |
Civlian Workforce | 5,879 | 55,827 | 148,957 | |
Military Workforce | 0 | 30 | 115 | |
Total Households | 3,692 | 38,553 | 99,992 | |
Family Households | 2,592 | 25,799 | 69,596 | |
Non-Family Households | 1,100 | 12,755 | 30,396 | |
Married Couple | 1,729 | 18,600 | 51,260 | |
Other Family | 863 | 7,199 | 18,336 | |
Married w/Child | 604 | 7,132 | 20,892 | |
Single Male w/Child | 64 | 679 | 2,226 | |
Single Female w/Child | 304 | 3,337 | 7,811 |
Population Change Last Two Decades - Plus Projection
2000 | % | 2010 | % | 2020 | % | 2030 | |
---|---|---|---|---|---|---|---|
Texas | 20,851,820 | +21 | 25,145,561 | +18 | 29,677,668 | +18 | 34,894,452 |
Tarrant County | 1,446,219 | +25 | 1,809,034 | +19 | 2,143,755 | +17 | 2,507,170 |
Total Working Age Population:
Total Households:
Total Working Age Population:
Total Households:
Total Working Age Population:
Total Households: