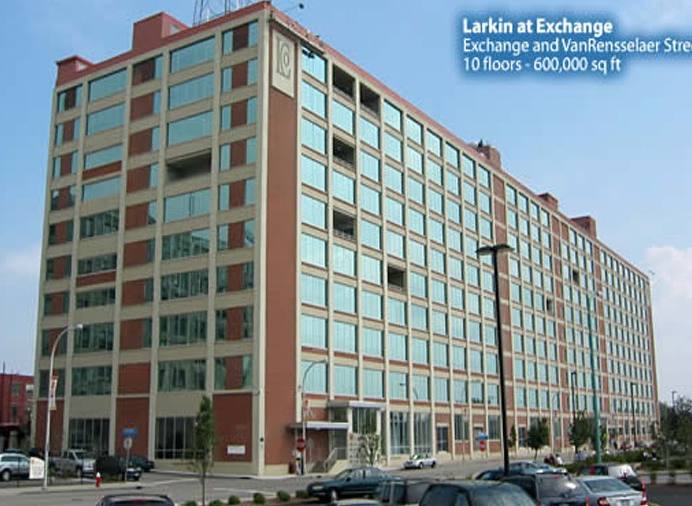
1-Mile | 3-Miles | 5-Miles | ||
---|---|---|---|---|
Total Population | 9,496 | 106,921 | 260,394 | |
Population Median Age | 40 | 39 | 38 | |
Population by Age | 0-9 Yrs | 1181 (12%) | 12650 (11%) | 32659 (12%) |
10-19 Yrs | 917 (9%) | 12306 (11%) | 31044 (11%) | |
20-29 Yrs | 1612 (16%) | 17248 (16%) | 45163 (17%) | |
30-39 Yrs | 1170 (12%) | 15459 (14%) | 36342 (13%) | |
40-49 Yrs | 707 (7%) | 12073 (11%) | 28179 (10%) | |
50-59 Yrs | 1602 (16%) | 14099 (13%) | 32945 (12%) | |
60-69 Yrs | 1453 (15%) | 12563 (11%) | 29187 (11%) | |
70+ Yrs | 854 (8%) | 10522 (9%) | 24875 (9%) | |
Median HH Income | $22,535 | $35,444 | $41,212 | |
Total Household Income | < 24K | 2521 (54%) | 19209 (38%) | 37697 (32%) |
25-49K | 868 (18%) | 11976 (24%) | 28478 (24%) | |
50-74K | 506 (10%) | 7955 (15%) | 19412 (16%) | |
75-99K | 229 (4%) | 4248 (8%) | 12300 (10%) | |
100-199K | 494 (10%) | 5508 (11%) | 14278 (12%) | |
200K+ | 35 (0%) | 980 (1%) | 2823 (2%) | |
Highest Education Level | No Diploma | 1560 | 11447 | 24312 |
Diploma or GED | 2343 | 22945 | 51924 | |
Some College | 1606 | 14597 | 35292 | |
Assoc. Degree | 642 | 7340 | 18960 | |
Bachelors Degree | 493 | 10884 | 26867 | |
Higher Degree | 226 | 7276 | 19017 | |
Total Housing Units | 6,000 | 60,754 | 134,931 | |
--Owner-Occupied | 1,707 | 20,471 | 53,306 | |
--Renter-Occupied | 2,946 | 29,406 | 61,682 | |
Owner-Occupied Values | < 100K | 1201 | 11609 | 26287 |
100-199K | 394 | 5326 | 16904 | |
200-299K | 69 | 1354 | 4296 | |
300-399K | 13 | 639 | 2202 | |
400-499K | 0 | 455 | 1127 | |
500K+ | 31 | 1088 | 2490 | |
Total Working Age Population | 7,742 | 86,484 | 210,188 | |
In Work Force | 4,127 | 51,167 | 127,058 | |
Not In Work Force | 3,615 | 35,317 | 83,131 | |
Workforce Employed | 3,569 | 46,692 | 117,461 | |
Workforce Unemployed | 558 | 4,417 | 9,378 | |
Civlian Workforce | 4,127 | 51,109 | 126,839 | |
Military Workforce | 0 | 58 | 219 | |
Total Households | 4,652 | 49,876 | 114,988 | |
Family Households | 2,112 | 23,251 | 57,431 | |
Non-Family Households | 2,540 | 26,625 | 57,557 | |
Married Couple | 952 | 11,543 | 29,697 | |
Other Family | 1,160 | 11,709 | 27,734 | |
Married w/Child | 188 | 4,303 | 11,290 | |
Single Male w/Child | 106 | 1,149 | 2,640 | |
Single Female w/Child | 530 | 5,031 | 11,296 |
Population Change Last Two Decades - Plus Projection
2000 | % | 2010 | % | 2020 | % | 2030 | |
---|---|---|---|---|---|---|---|
New York | 18,976,457 | +2 | 19,378,102 | +4 | 20,146,131 | +2 | 20,604,030 |
Erie County | 950,265 | -3 | 919,040 | +2 | 936,084 | +1 | 949,073 |
Total Working Age Population:
Total Households:
Total Working Age Population:
Total Households:
Total Working Age Population:
Total Households: