Retail Space
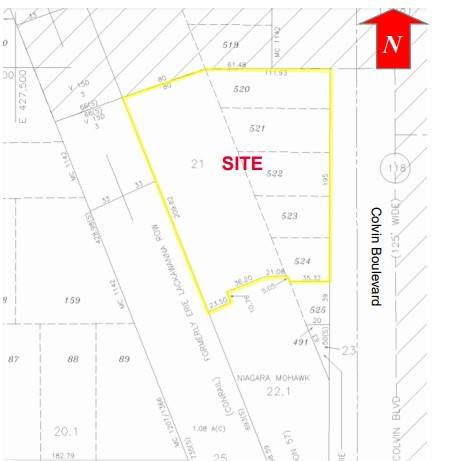
1856 Colvin Boulevard Tonawanda, NY 14150
1856 Colvin Boulevard Tonawanda, NY 14150
Details & Description
Property Highlights
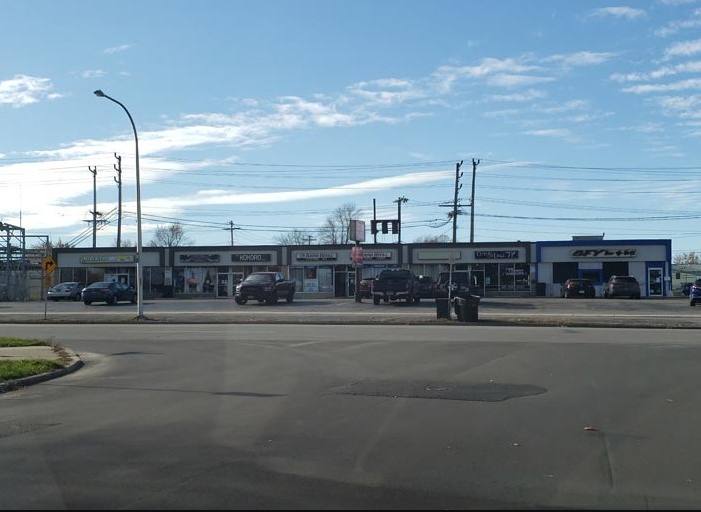
- • Great neighborhood center
- • Great visibility
- • Close to the I-290 Expressway
- • Excellent tenant mix
- • • Office / Retail space available
- • Central Tonawanda, NY location
Listing Agents

Robert H. Cowing III
O: 716-852-7500
M: 716-870-1011
rcowing@pyramidbrokerage.com
O: 716-852-7500
M: 716-870-1011
rcowing@pyramidbrokerage.com
While we strive to provide the most accurate information, all listing information, and demographic data, is provided by third-parties. As such, MyEListing will not be responsible for the accuracy of the information. It is strongly recommended that you verify all information with the listing agent, and any relevant agencies, prior to making any decisions.