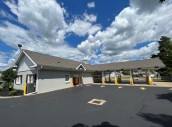
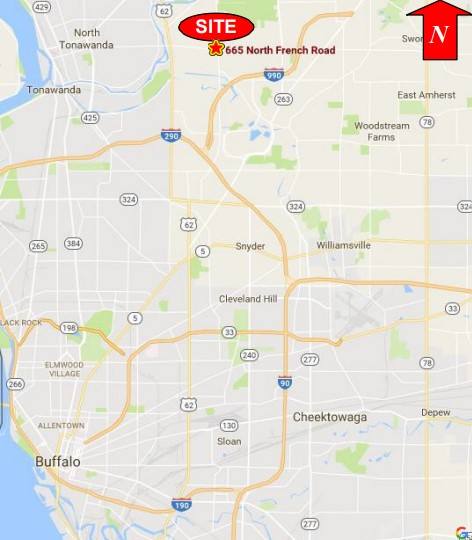
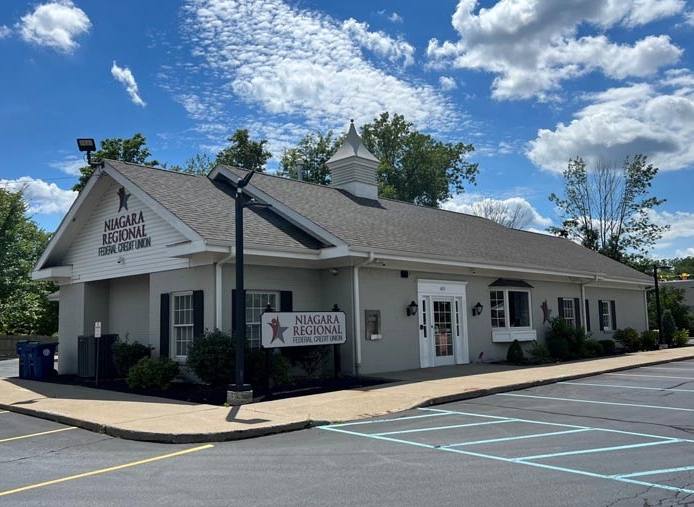
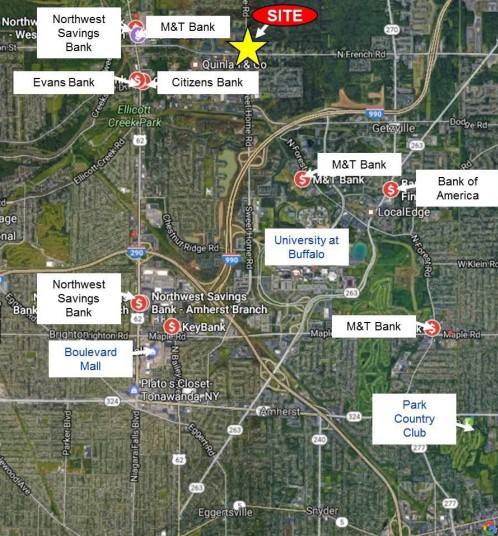
1-Mile | 3-Miles | 5-Miles | ||
---|---|---|---|---|
Total Population | 5,136 | 53,605 | 174,820 | |
Population Median Age | 38 | 40 | 42 | |
Population by Age | 0-9 Yrs | 510 (9%) | 4172 (7%) | 16347 (9%) |
10-19 Yrs | 805 (15%) | 8850 (16%) | 22717 (12%) | |
20-29 Yrs | 771 (15%) | 9729 (18%) | 24134 (13%) | |
30-39 Yrs | 844 (16%) | 6447 (12%) | 21834 (12%) | |
40-49 Yrs | 618 (12%) | 5020 (9%) | 18155 (10%) | |
50-59 Yrs | 468 (9%) | 6075 (11%) | 24057 (13%) | |
60-69 Yrs | 521 (10%) | 6063 (11%) | 22779 (13%) | |
70+ Yrs | 599 (11%) | 7250 (13%) | 24796 (14%) | |
Median HH Income | $63,504 | $65,024 | $69,345 | |
Total Household Income | < 24K | 396 (20%) | 4234 (20%) | 13373 (18%) |
25-49K | 355 (17%) | 3963 (18%) | 13619 (18%) | |
50-74K | 454 (22%) | 3475 (16%) | 12347 (16%) | |
75-99K | 286 (14%) | 2704 (12%) | 10291 (13%) | |
100-199K | 405 (20%) | 5096 (24%) | 18873 (25%) | |
200K+ | 79 (3%) | 1403 (6%) | 5078 (6%) | |
Highest Education Level | No Diploma | 300 | 2265 | 7177 |
Diploma or GED | 590 | 6840 | 26861 | |
Some College | 641 | 6109 | 20977 | |
Assoc. Degree | 354 | 4044 | 14869 | |
Bachelors Degree | 749 | 8417 | 29173 | |
Higher Degree | 667 | 6934 | 24210 | |
Total Housing Units | 2,216 | 22,332 | 78,158 | |
--Owner-Occupied | 1,191 | 13,134 | 53,439 | |
--Renter-Occupied | 785 | 7,742 | 20,143 | |
Owner-Occupied Values | < 100K | 42 | 1389 | 7610 |
100-199K | 636 | 6427 | 26700 | |
200-299K | 356 | 3136 | 11362 | |
300-399K | 117 | 1330 | 4926 | |
400-499K | 16 | 280 | 1403 | |
500K+ | 25 | 571 | 1437 | |
Total Working Age Population | 4,079 | 46,037 | 146,975 | |
In Work Force | 2,662 | 26,592 | 91,354 | |
Not In Work Force | 1,417 | 19,445 | 55,621 | |
Workforce Employed | 2,366 | 25,183 | 87,189 | |
Workforce Unemployed | 283 | 1,297 | 3,976 | |
Civlian Workforce | 2,648 | 26,481 | 91,165 | |
Military Workforce | 13 | 111 | 189 | |
Total Households | 1,976 | 20,875 | 73,582 | |
Family Households | 1,296 | 11,931 | 43,995 | |
Non-Family Households | 680 | 8,944 | 29,587 | |
Married Couple | 822 | 8,932 | 34,035 | |
Other Family | 475 | 3,000 | 9,959 | |
Married w/Child | 326 | 3,172 | 11,939 | |
Single Male w/Child | 13 | 246 | 1,161 | |
Single Female w/Child | 210 | 967 | 3,431 |
Population Change Last Two Decades - Plus Projection
2000 | % | 2010 | % | 2020 | % | 2030 | |
---|---|---|---|---|---|---|---|
New York | 18,976,457 | +2 | 19,378,102 | +4 | 20,146,131 | +2 | 20,604,030 |
Erie County | 950,265 | -3 | 919,040 | +2 | 936,084 | +1 | 949,073 |
Niagara County | 219,846 | -2 | 216,469 | -3 | 209,940 | -3 | 202,950 |
Total Working Age Population:
Total Households:
Total Working Age Population:
Total Households:
Total Working Age Population:
Total Households: