Office Space
310 Race Street Cincinnati, OH 45202
310 Race Street Cincinnati, OH 45202

Details & Description
Property Highlights
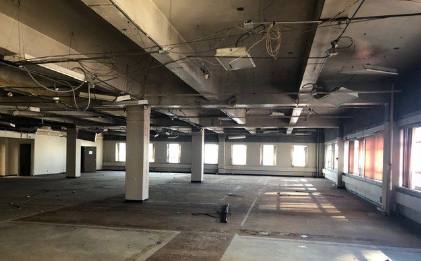
- • 12-FLOOR former office building for sale
- • Approx. 9,800 SF per floor
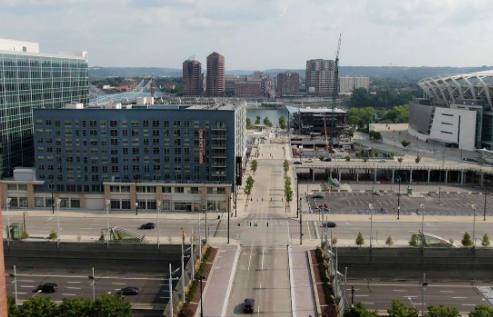
- • Adjacent 30-car surface parking lot included
- • 2 freight elevators
- • 2 passenger elevators
- • Redevelopment opportunity
Additional Photos

Listing Agents

Bill Schneller
O: 513-588-1108
M: 513-325-4287
wschneller@lee-associates.com
O: 513-588-1108
M: 513-325-4287
wschneller@lee-associates.com
While we strive to provide the most accurate information, all listing information, and demographic data, is provided by third-parties. As such, MyEListing will not be responsible for the accuracy of the information. It is strongly recommended that you verify all information with the listing agent, and any relevant agencies, prior to making any decisions.


