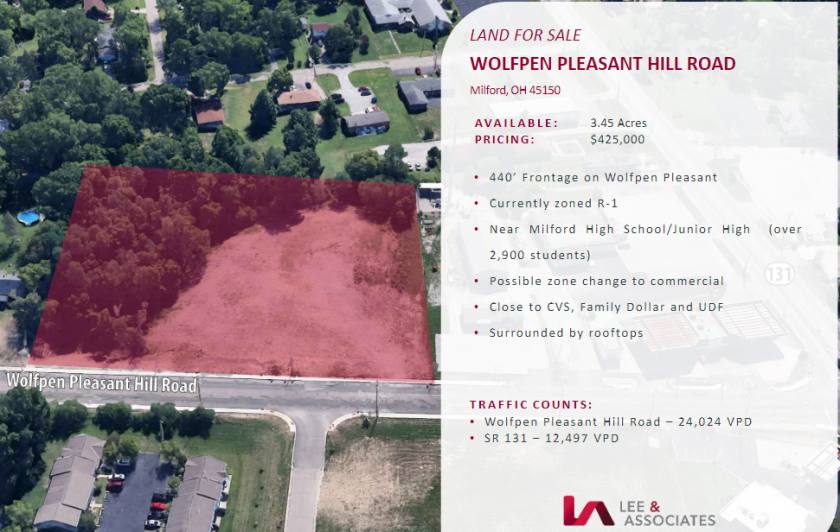
Commercial Land
Wolfpen Pleasant Hill Road Milford, OH 45150
Wolfpen Pleasant Hill Road Milford, OH 45150
Details & Description
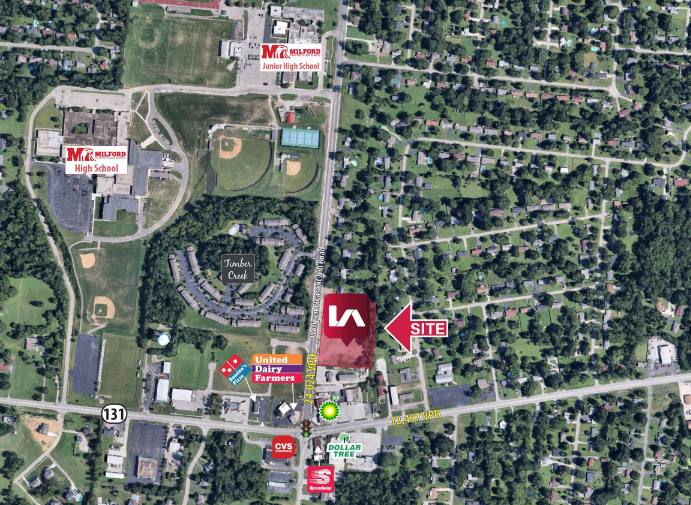
Property Highlights
- • 440’ Frontage on Wolfpen Pleasant
- • Currently zoned R - 1
- • Possible zone change to commercial
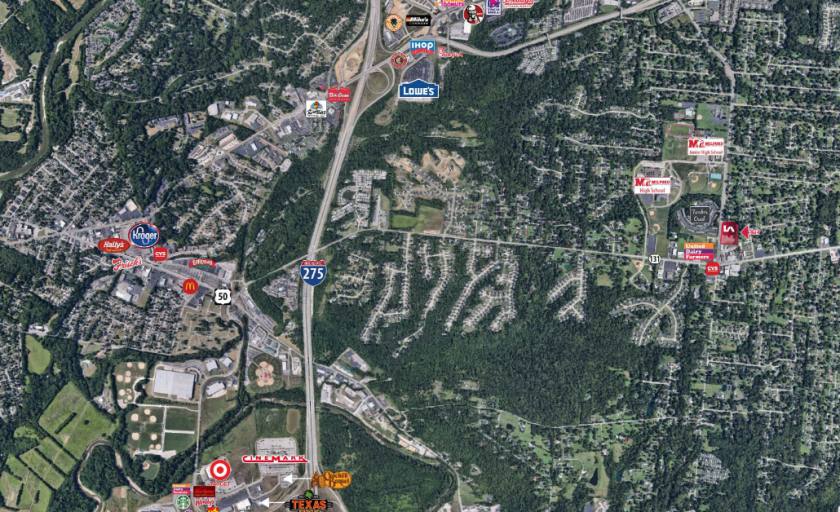
- • Close to CVS, Family Dollar and UDF
- • Surrounded by rooftops
Listing Agents

Chris Nachtrab
O: 513-588-1841
M: 513-604-1899
cnachtrab@lee-associates.com
O: 513-588-1841
M: 513-604-1899
cnachtrab@lee-associates.com

TC Bartoszek
O: 513-588-1840
M: 513-535-0563
tcbartoszek@lee-associates.com
O: 513-588-1840
M: 513-535-0563
tcbartoszek@lee-associates.com
While we strive to provide the most accurate information, all listing information, and demographic data, is provided by third-parties. As such, MyEListing will not be responsible for the accuracy of the information. It is strongly recommended that you verify all information with the listing agent, and any relevant agencies, prior to making any decisions.