Commercial Land
3000 Disney Street Cincinnati, OH 45209
3000 Disney Street Cincinnati, OH 45209
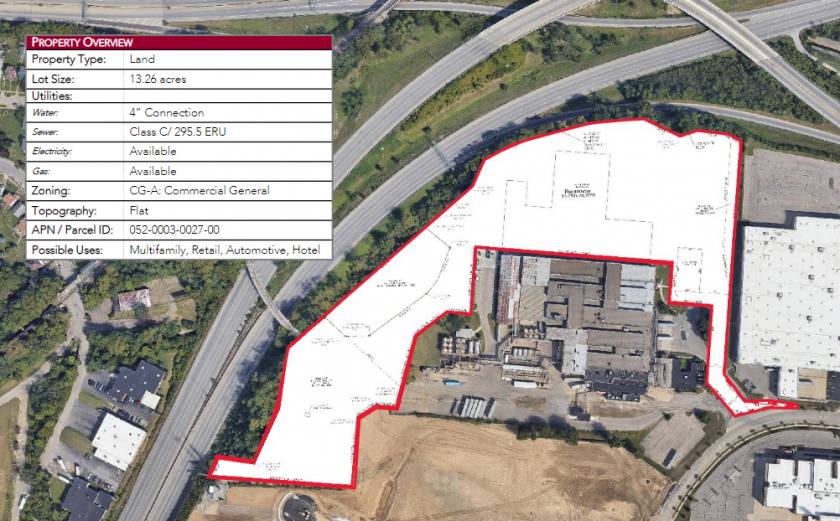
Details & Description
Property Highlights
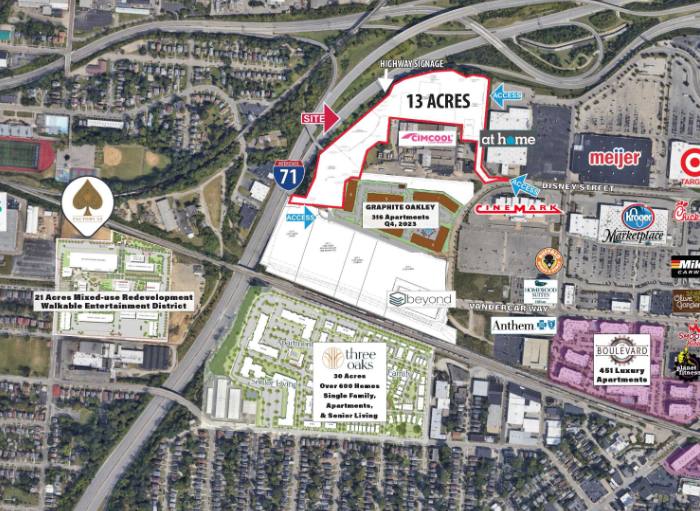
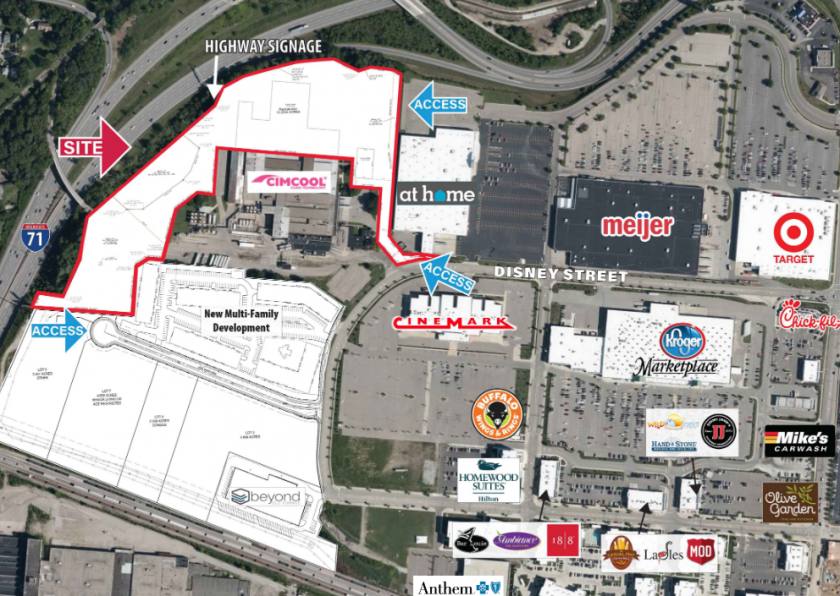
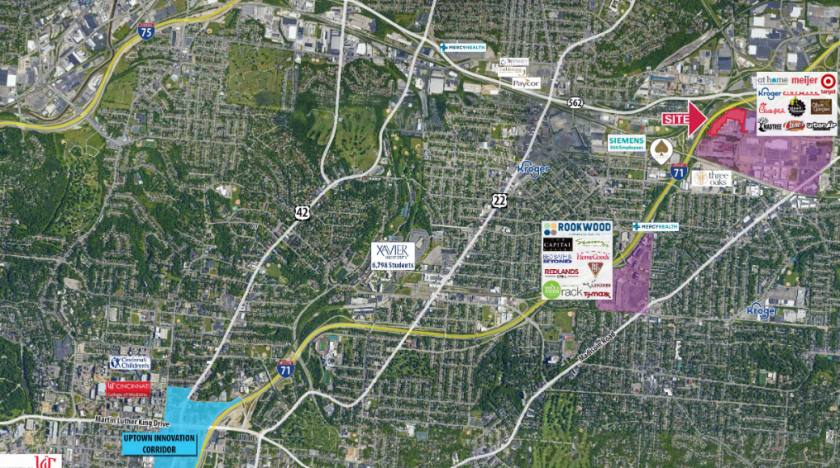
• Located near major retailers in Oakley Station, along with the new Boulevard at Oakley Station Multifamily complex
• Almost ½ mile of highway frontage(.404miles) (Highway Signage Available)
Additional Photos

Listing Agents

George Flynn
O: 513-588-1126
M: 513-325-9333
gflynn@lee-associates.com
O: 513-588-1126
M: 513-325-9333
gflynn@lee-associates.com

TC Bartoszek
O: 513-588-1840
M: 513-535-0563
tcbartoszek@lee-associates.com
O: 513-588-1840
M: 513-535-0563
tcbartoszek@lee-associates.com
While we strive to provide the most accurate information, all listing information, and demographic data, is provided by third-parties. As such, MyEListing will not be responsible for the accuracy of the information. It is strongly recommended that you verify all information with the listing agent, and any relevant agencies, prior to making any decisions.


