Commercial Land
4894 Ridge Avenue Cincinnati, OH 45209
4894 Ridge Avenue Cincinnati, OH 45209
Details & Description
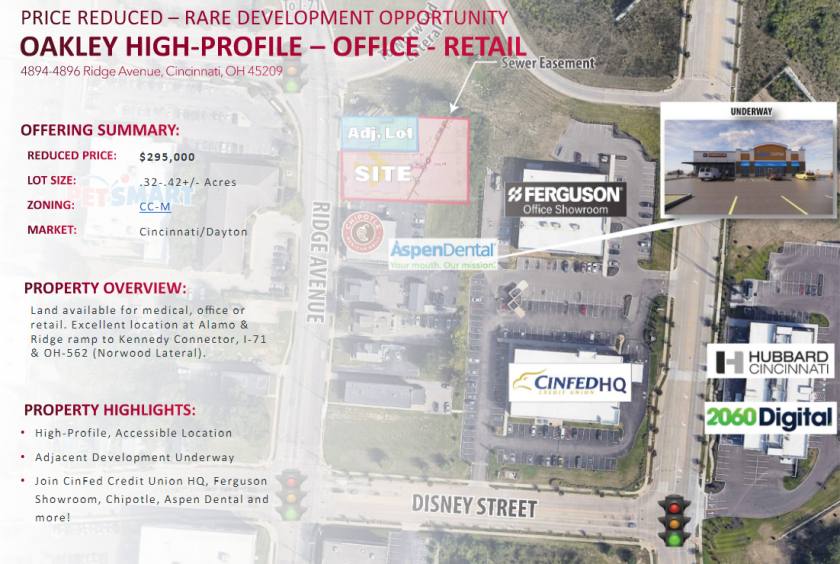
Property Highlights
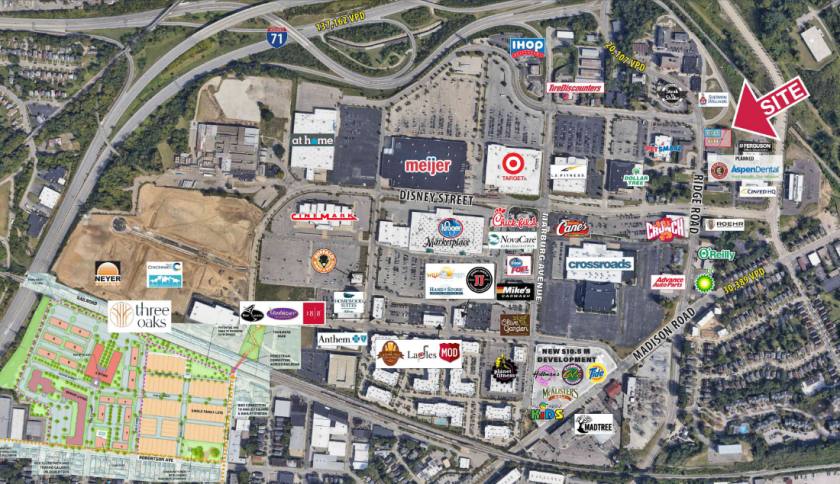
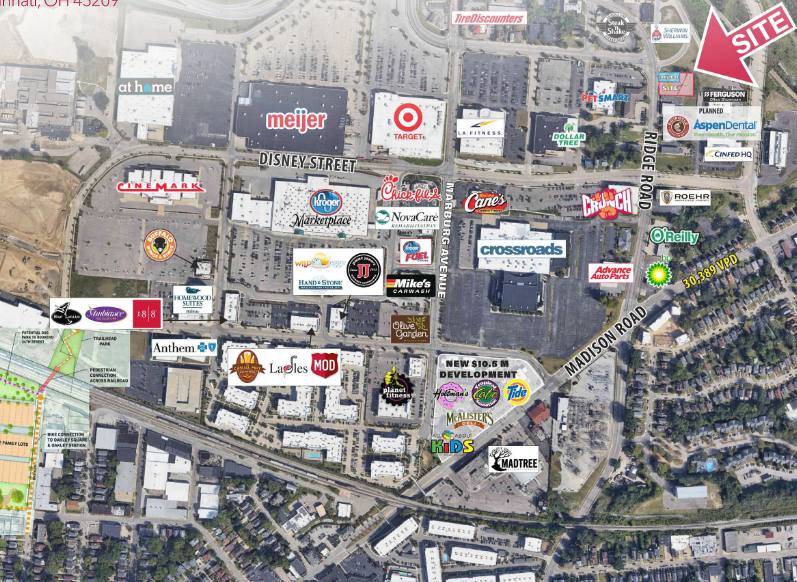
• Join CinFed Credit Union HQ, Ferguson Showroom, Chipotle, Aspen Dental and more!
• High-Profile, Accessible Location
Listing Agents

Gary Fisher
O: 513-588-1125
M: 513-658-3411
gfisher@lee-associates.com
O: 513-588-1125
M: 513-658-3411
gfisher@lee-associates.com
While we strive to provide the most accurate information, all listing information, and demographic data, is provided by third-parties. As such, MyEListing will not be responsible for the accuracy of the information. It is strongly recommended that you verify all information with the listing agent, and any relevant agencies, prior to making any decisions.