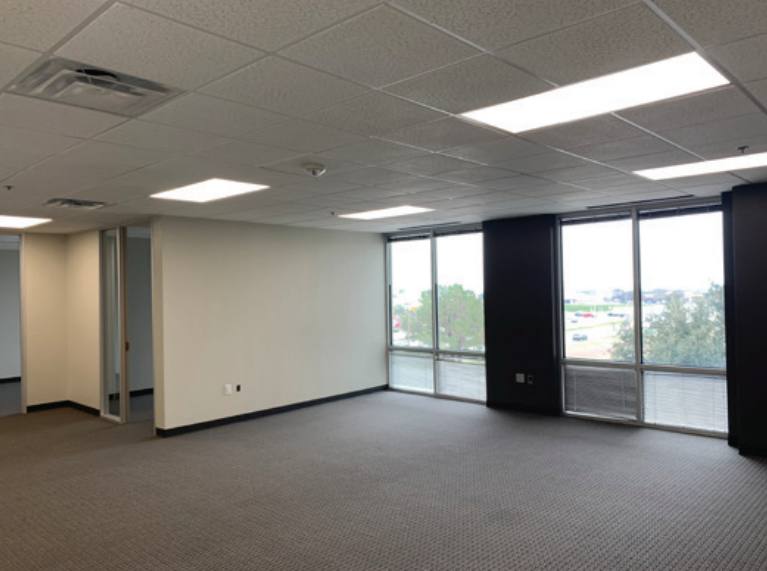
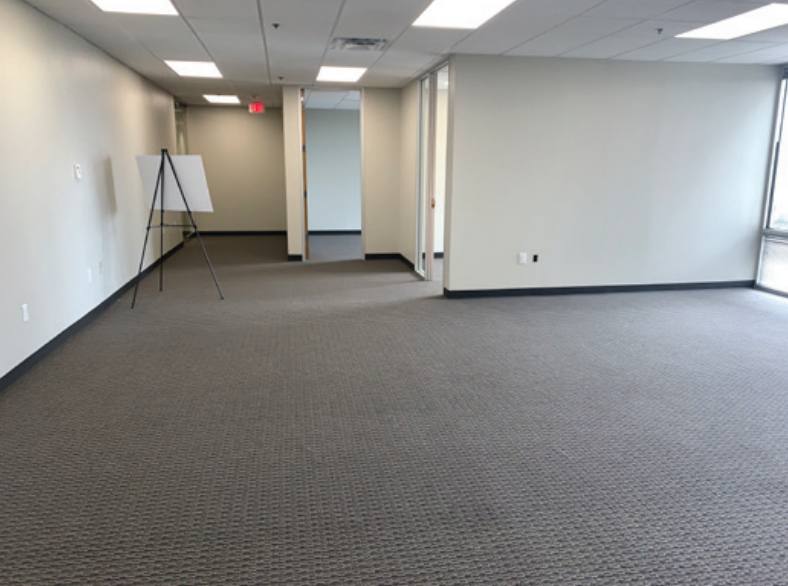
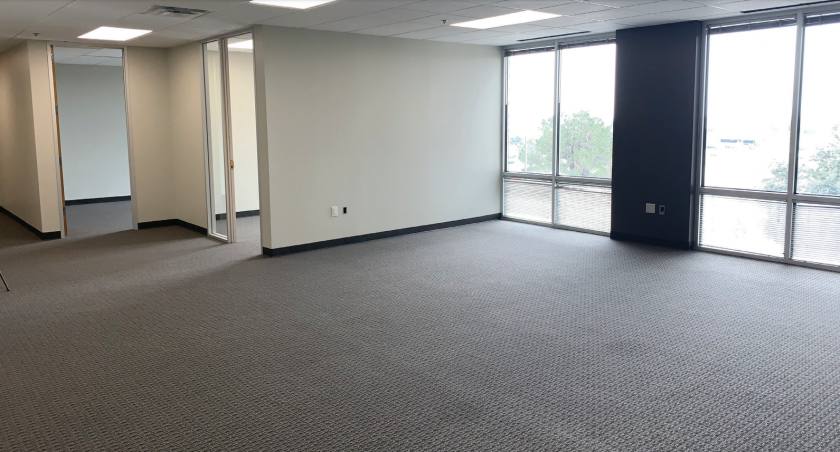
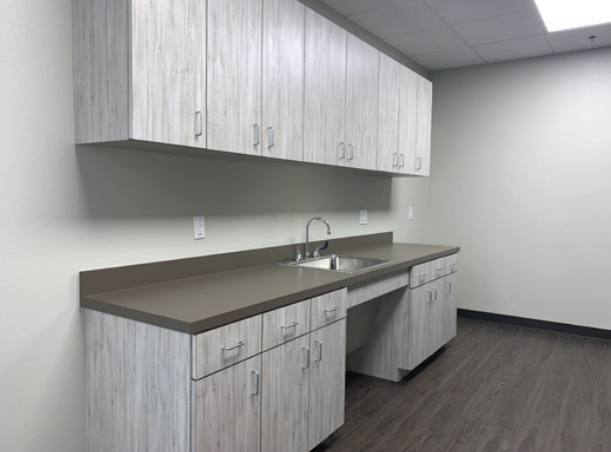
Office Space
700 Highlander Boulevard Arlington, TX 76015
700 Highlander Boulevard Arlington, TX 76015

Details & Description
Property Highlights
- • Interstate 20
- • The Parks Mall
- • USMD Medical Center
- • Arlington Medical Center
- • Arlington Highlands
- • Numerous Restaurants
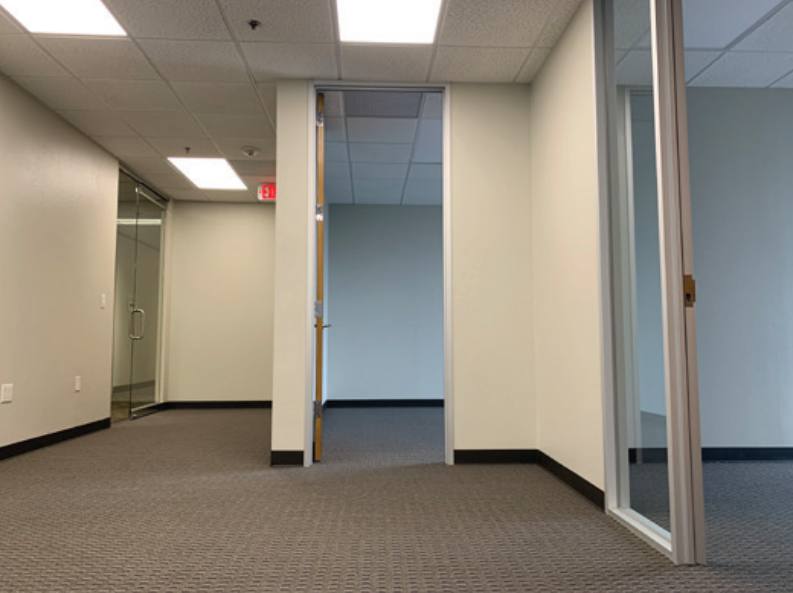
Additional Photos
Listing Agents

Jake Neal
O: 817-710-1112
M: 817-606-7820
jneal@holtlunsford.com
O: 817-710-1112
M: 817-606-7820
jneal@holtlunsford.com

Matt Carthey
O: 817-710-1111
mcarthey@holtlunsford.com
O: 817-710-1111
mcarthey@holtlunsford.com
While we strive to provide the most accurate information, all listing information, and demographic data, is provided by third-parties. As such, MyEListing will not be responsible for the accuracy of the information. It is strongly recommended that you verify all information with the listing agent, and any relevant agencies, prior to making any decisions.