Industrial Properties
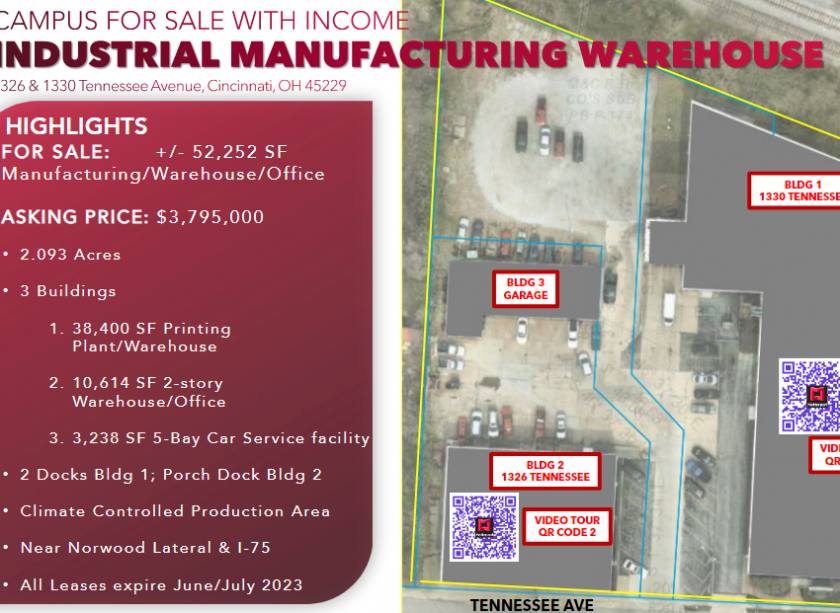
1326 and 1330 Tennessee Avenue Cincinnati, OH 45229
1326 and 1330 Tennessee Avenue Cincinnati, OH 45229
Details & Description
Property Highlights
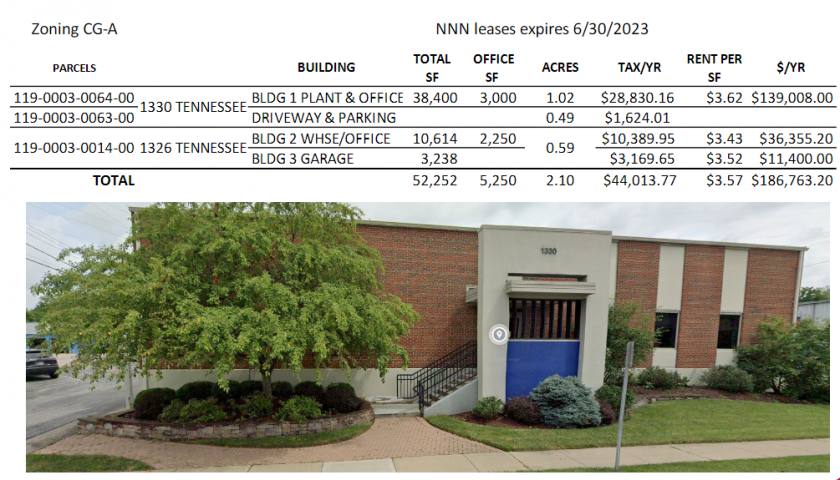
- • 2.093 Acres
- • 3 Buildings
- • Building 1. 38,400 SF Printing Plant/Warehouse
- • Building 2.10,614 SF 2-story Warehouse/Office
- • Building 3. 3,238 SF 5-Bay Car Service facility
- • 2 Docks Bldg1; Porch Dock Building 2
Listing Agents

Gary Fisher
O: 513-588-1125
M: 513-658-3411
gfisher@lee-associates.com
O: 513-588-1125
M: 513-658-3411
gfisher@lee-associates.com
While we strive to provide the most accurate information, all listing information, and demographic data, is provided by third-parties. As such, MyEListing will not be responsible for the accuracy of the information. It is strongly recommended that you verify all information with the listing agent, and any relevant agencies, prior to making any decisions.