Industrial Properties
96 Caldwell Drive Cincinnati, OH 45216
96 Caldwell Drive Cincinnati, OH 45216
Details & Description
Property Highlights
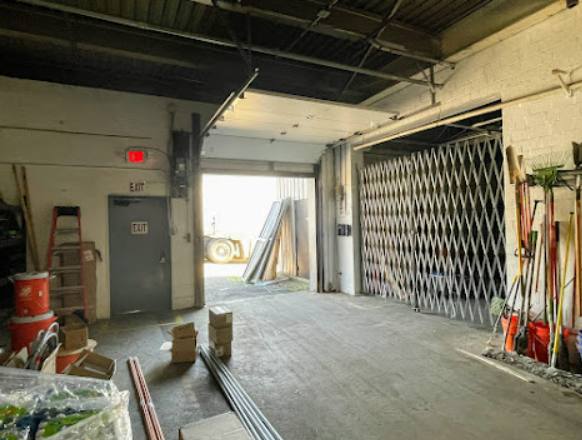
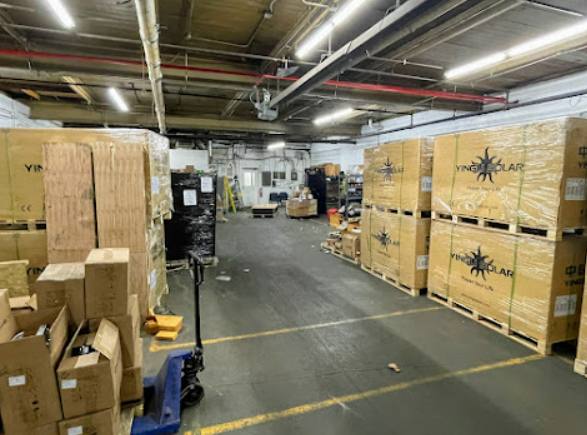
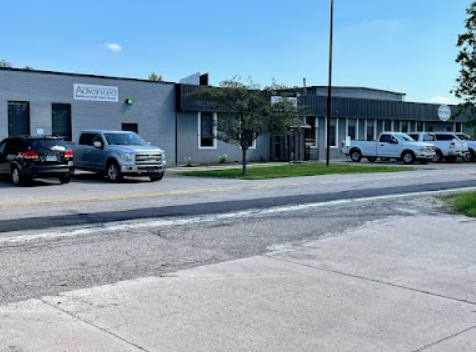
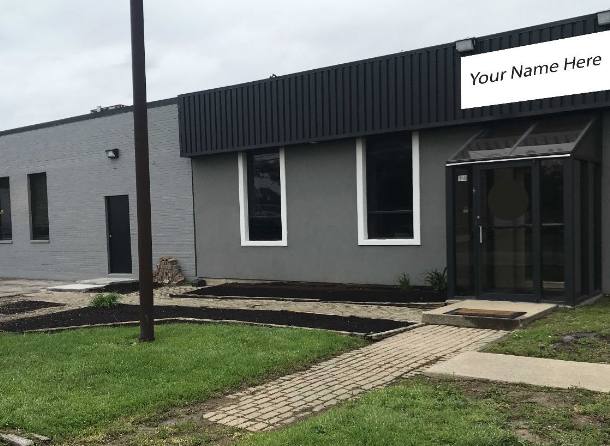
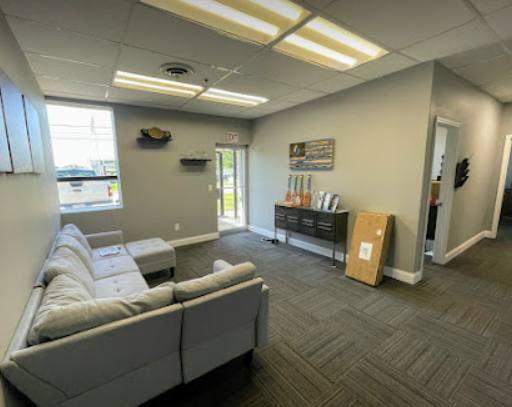
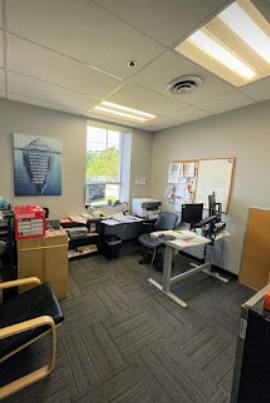
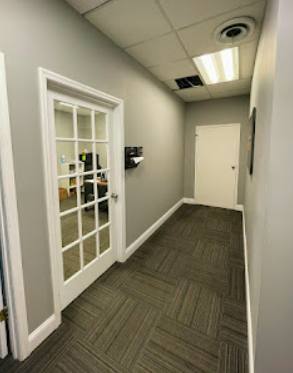
- • Nicely finished offices, modified to suit
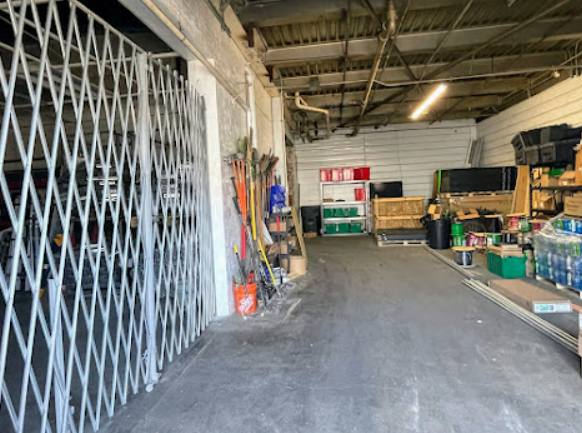
- • Secure parking & outdoor storage
- • Heavy power available
- • Access to shared docks
- • On site property management
- • Fully sprinkled
Additional Photos
Listing Agents

Gary Fisher
O: 513-588-1125
M: 513-658-3411
gfisher@lee-associates.com
O: 513-588-1125
M: 513-658-3411
gfisher@lee-associates.com
While we strive to provide the most accurate information, all listing information, and demographic data, is provided by third-parties. As such, MyEListing will not be responsible for the accuracy of the information. It is strongly recommended that you verify all information with the listing agent, and any relevant agencies, prior to making any decisions.