Office Space
1610 Interstate 35 Frontage Road San Antonio, TX 78208
1610 Interstate 35 Frontage Road San Antonio, TX 78208

Details & Description
Property Highlights
- • Close proximity to Downtown San Antonio
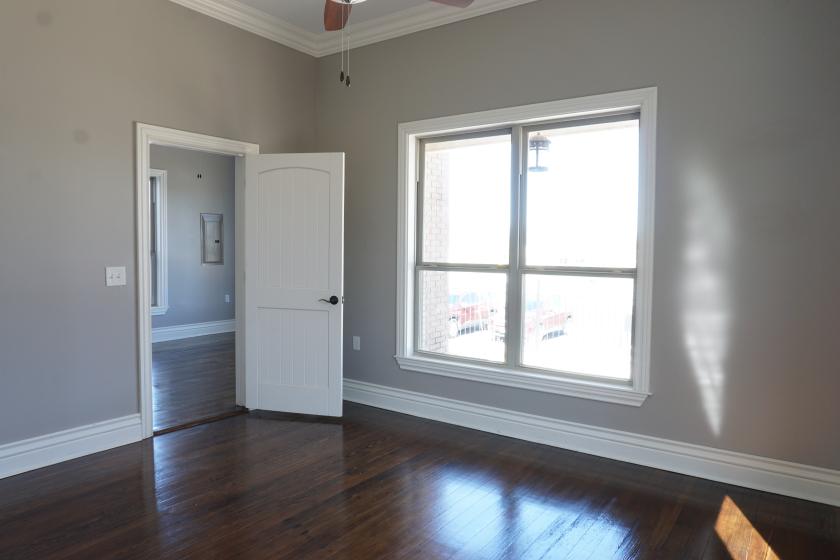
- • Recently renovated
- • Property is fenced with automatic gate
- • Secure parking in back of property
Additional Photos


Listing Agents

Hayley Ruggles
M: 210-710-4722
hruggles@endurasa.com
M: 210-710-4722
hruggles@endurasa.com
While we strive to provide the most accurate information, all listing information, and demographic data, is provided by third-parties. As such, MyEListing will not be responsible for the accuracy of the information. It is strongly recommended that you verify all information with the listing agent, and any relevant agencies, prior to making any decisions.


