Industrial Properties
26650 - 26700 Eight Mile Rd Southfield, MI 48033
26650 - 26700 Eight Mile Rd Southfield, MI 48033
Details & Description
Property Highlights
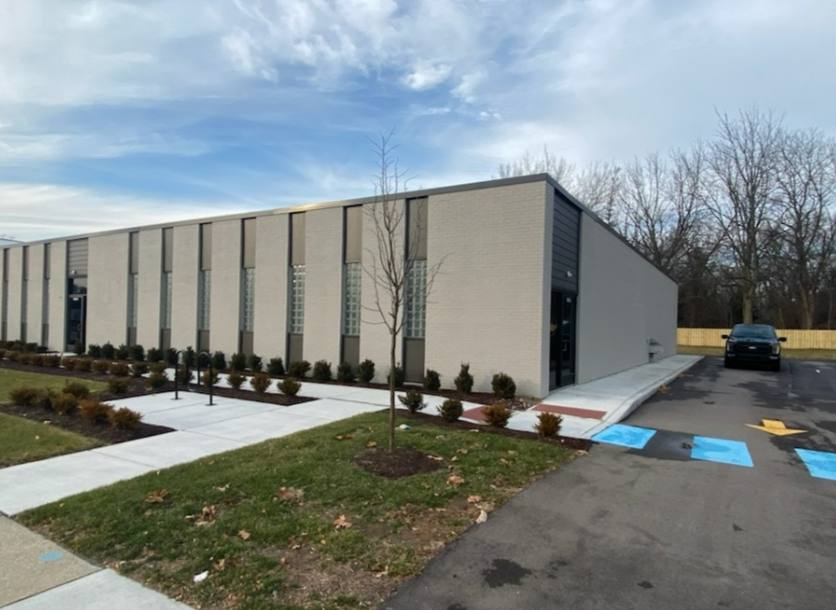
- • Year Built 1969
- • Great 8 Mile Rd signage opportunity
- • Recent building improvements
- • 30,448 VPD
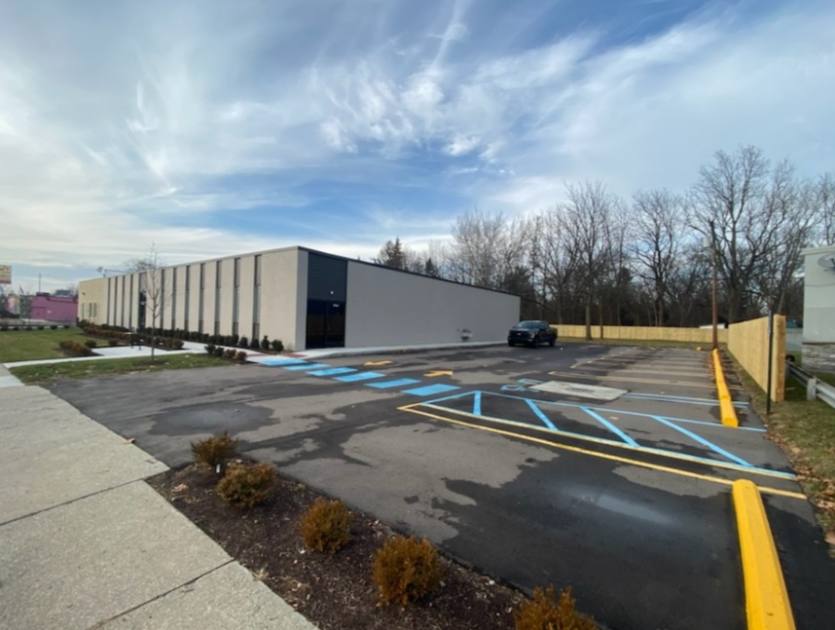
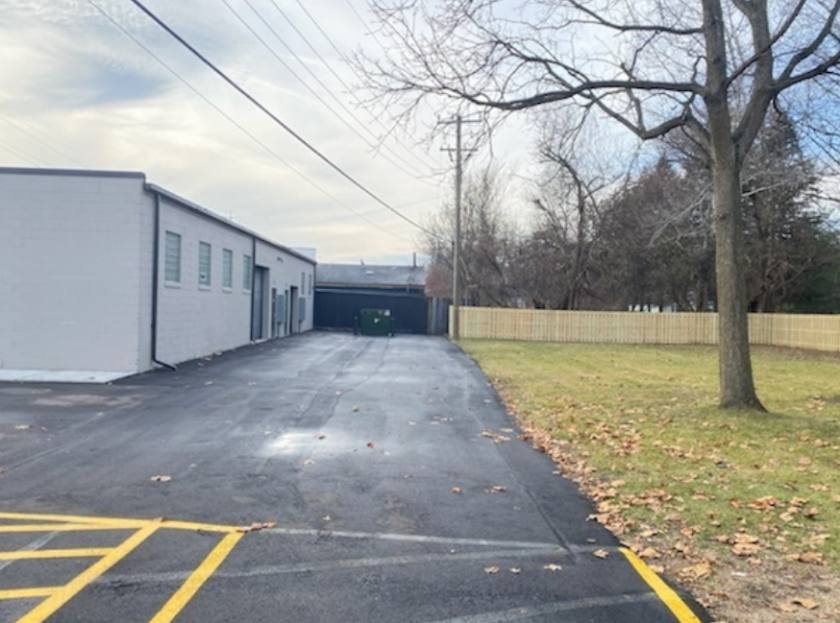
- • Ample parking and power
- • Large lot available for expansion
Additional Photos

Listing Agents

John De Wald
O: 248358010011
M: 313-510-3777
johnd@pacommercial.com
O: 248358010011
M: 313-510-3777
johnd@pacommercial.com

Matthew Schiffman
O: 248-281-9907
M: 248-943-6449
matt@pacommercial.com
O: 248-281-9907
M: 248-943-6449
matt@pacommercial.com
While we strive to provide the most accurate information, all listing information, and demographic data, is provided by third-parties. As such, MyEListing will not be responsible for the accuracy of the information. It is strongly recommended that you verify all information with the listing agent, and any relevant agencies, prior to making any decisions.


