Industrial Properties
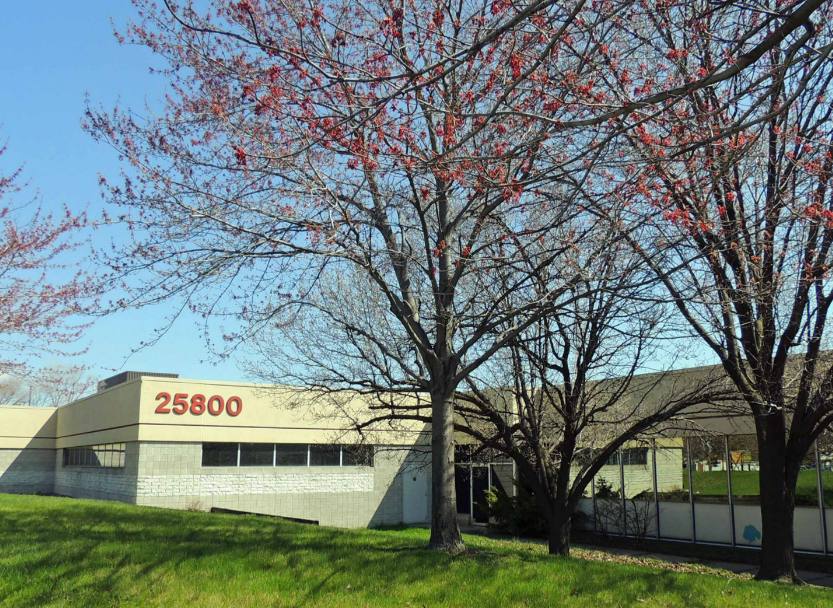
25800 - 25840 Sherwood Ave Warren, MI 48091
25800 - 25840 Sherwood Ave Warren, MI 48091
Details & Description
Property Highlights
- • Year Built 1980
- • Close to I-696
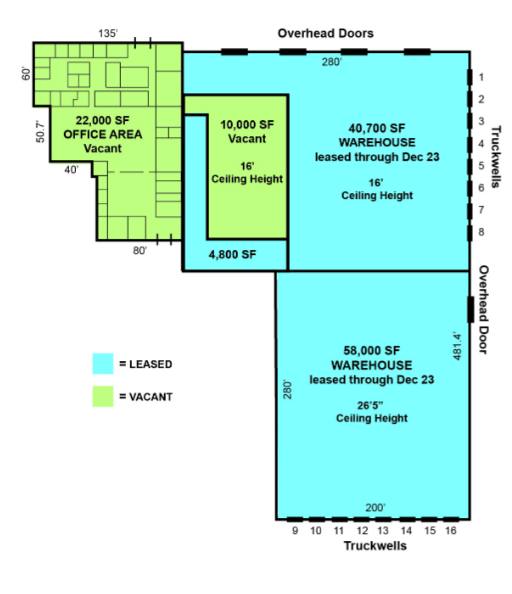
- • Owner-user or investment opportunity
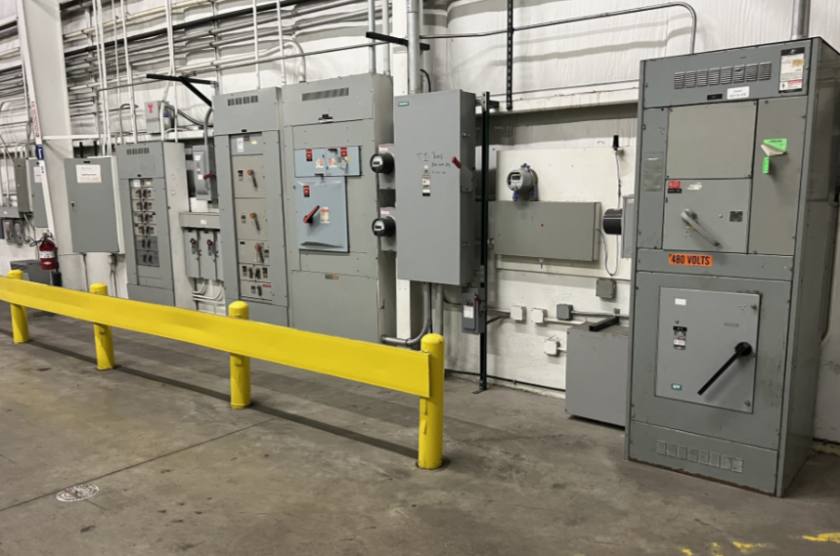
- • Low vacancy industrial area
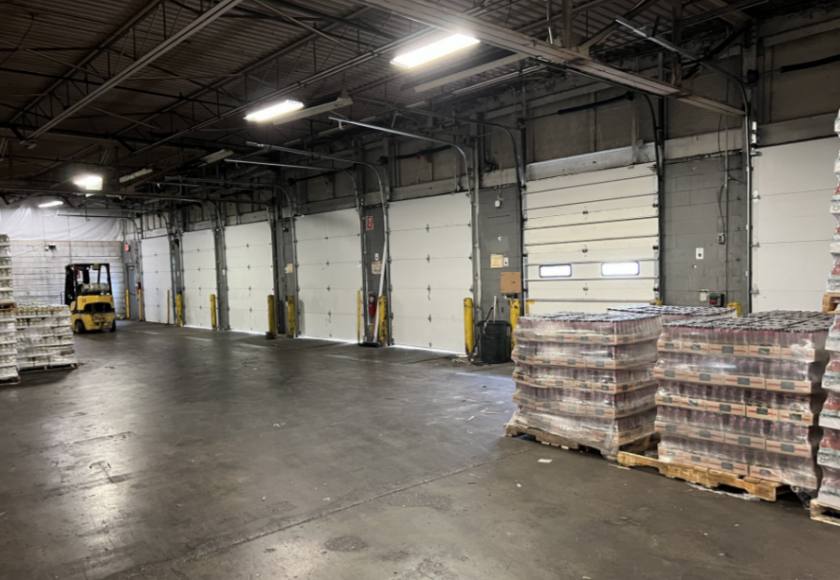
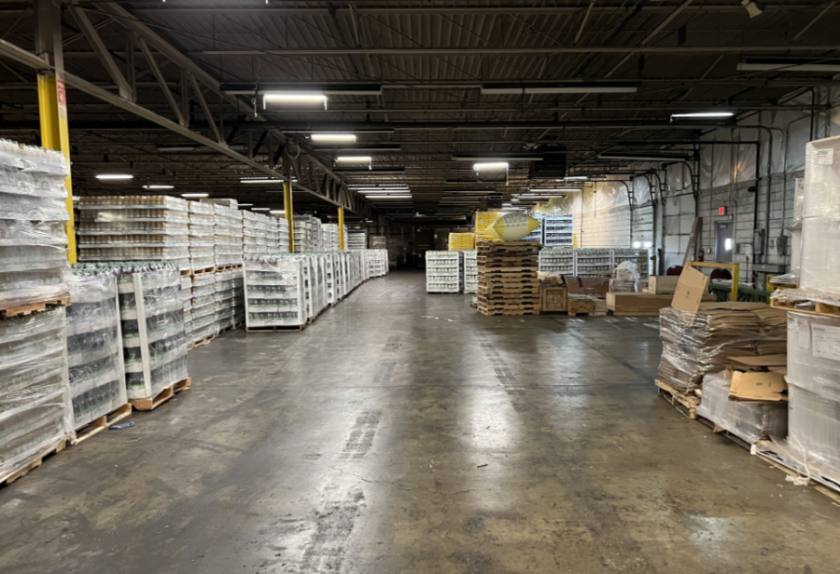
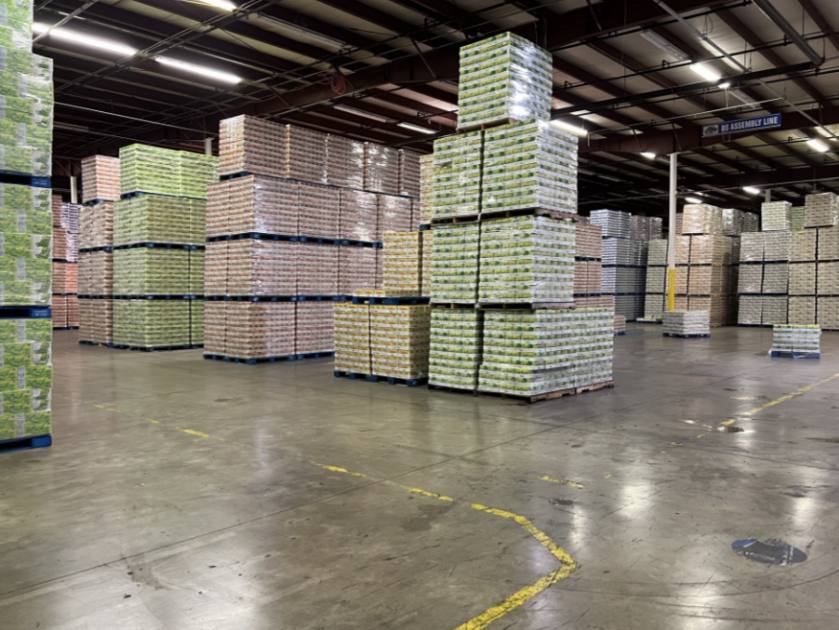
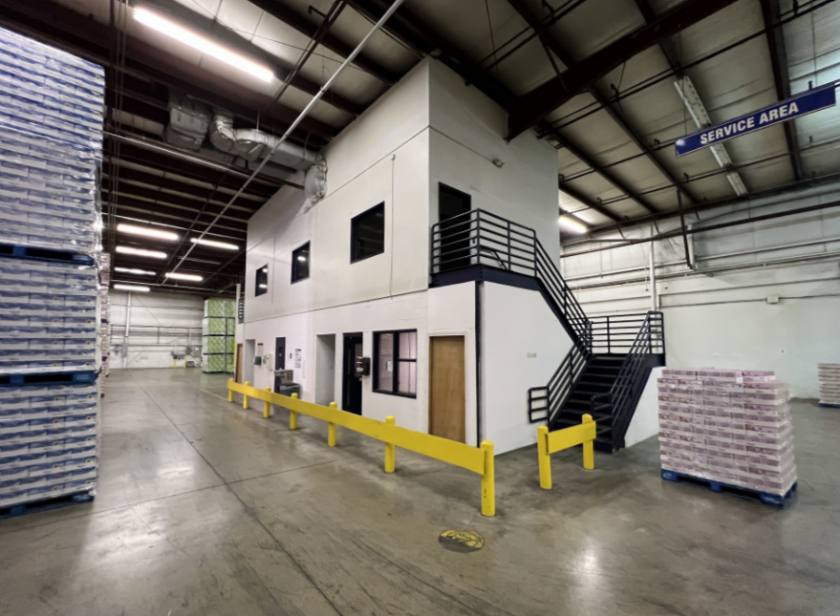
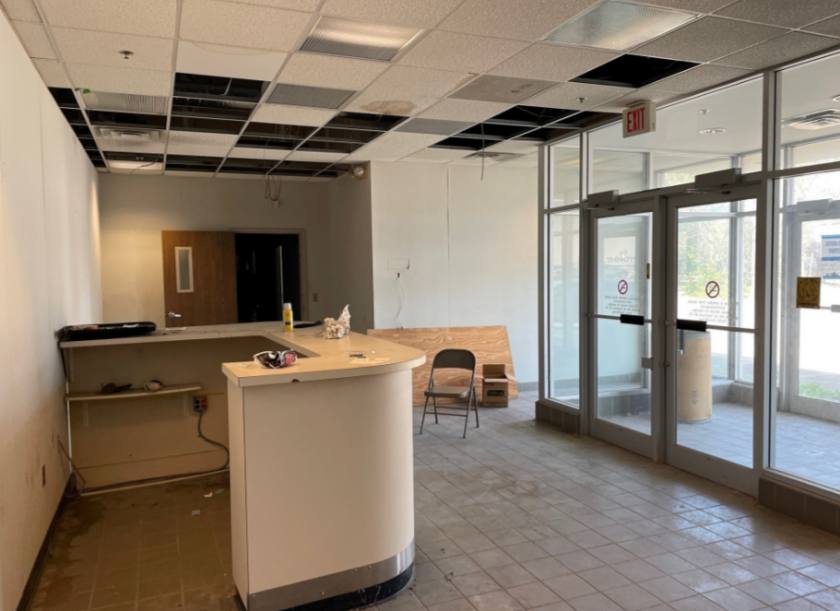
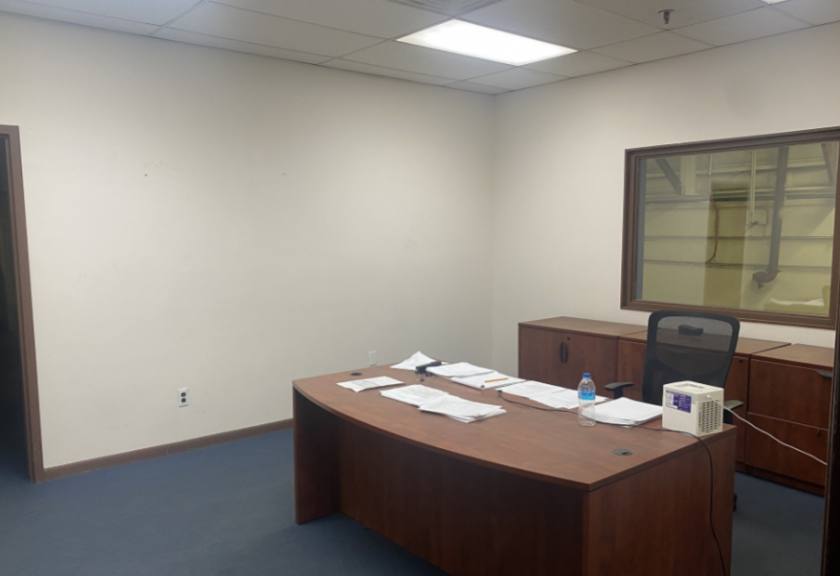
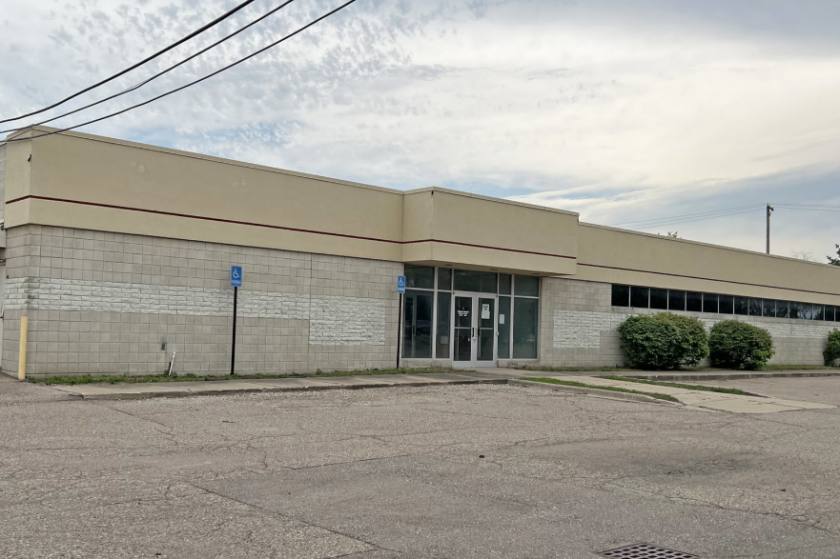
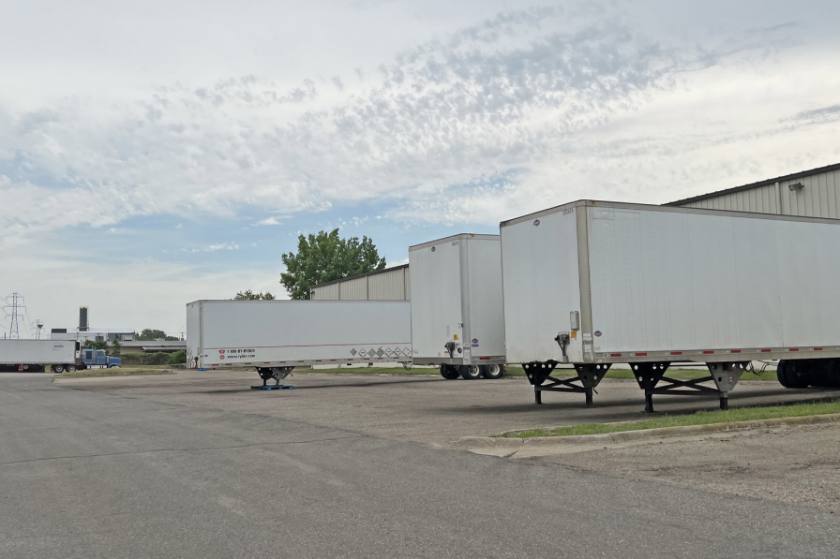
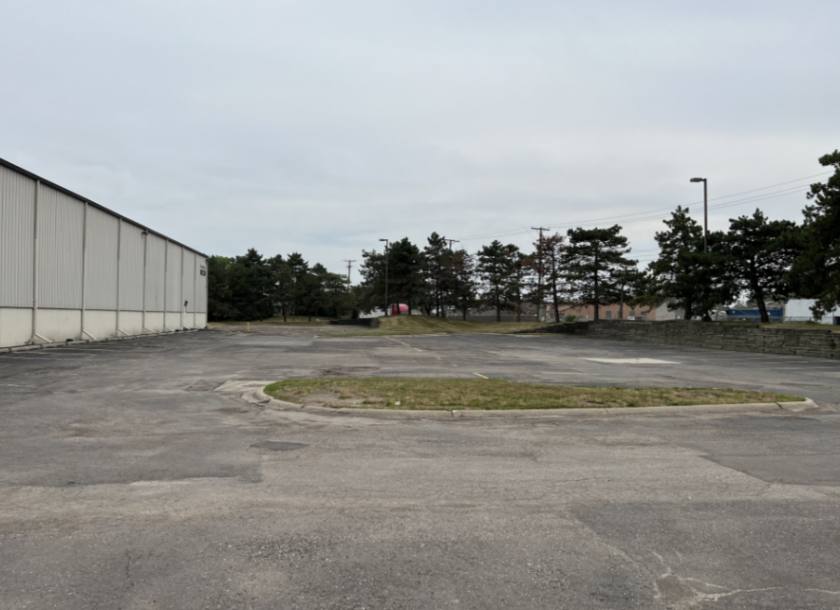
Additional Photos

Listing Agents

Levi Smith
O: 248-331-0205
M: 248-496-3339
levi@pacommercial.com
O: 248-331-0205
M: 248-496-3339
levi@pacommercial.com

Kevin Bull
O: 248-358-5361
M: 248-895-9972
kevin@pacommercial.com
O: 248-358-5361
M: 248-895-9972
kevin@pacommercial.com
While we strive to provide the most accurate information, all listing information, and demographic data, is provided by third-parties. As such, MyEListing will not be responsible for the accuracy of the information. It is strongly recommended that you verify all information with the listing agent, and any relevant agencies, prior to making any decisions.