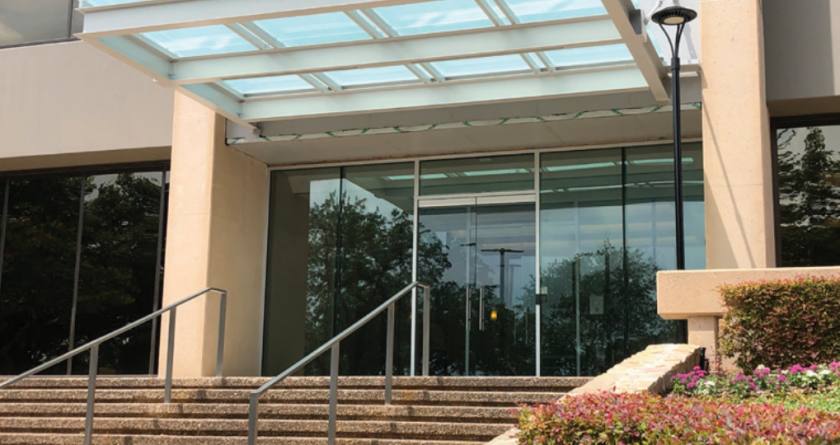
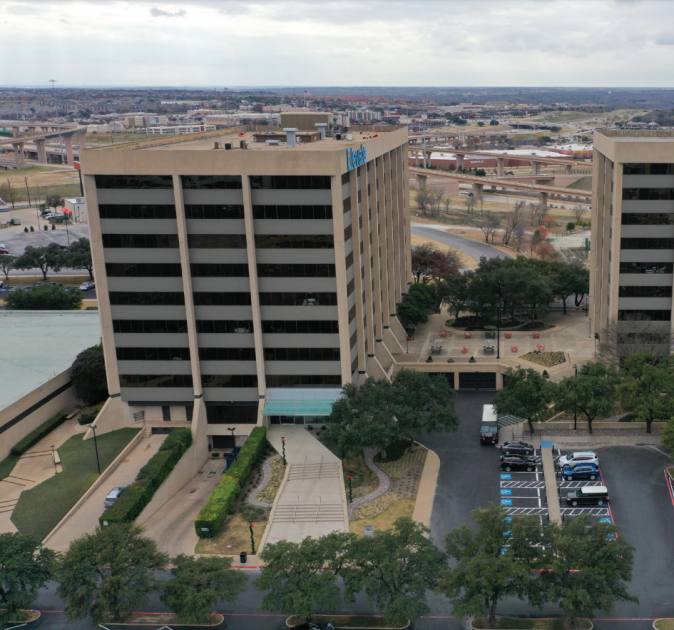
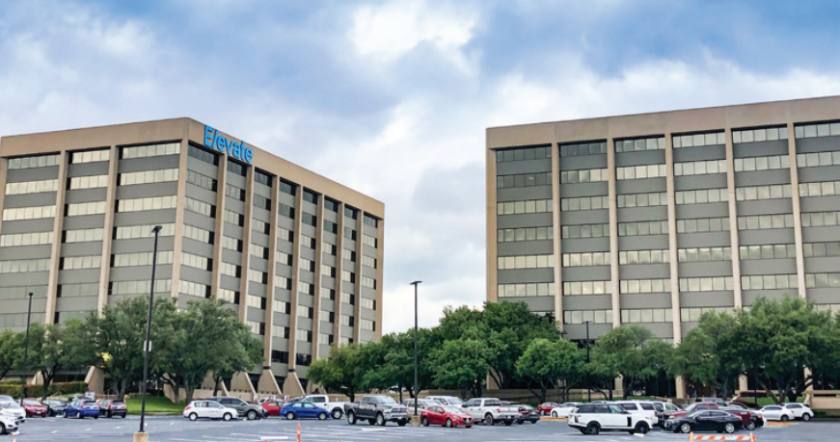
Office Space
4100-4150 International Plaza Fort Worth, TX 76109
4100-4150 International Plaza Fort Worth, TX 76109
Details & Description
Property Highlights
- • Dual electrical feed from two separate substations
- • 4.0/1,000 parking ratio
- • Fitness center with locker rooms
- • 50 seat auditorium/conference center
- • Document storage available in basement
- • Centrally located between Bryant Irvin and Hulen
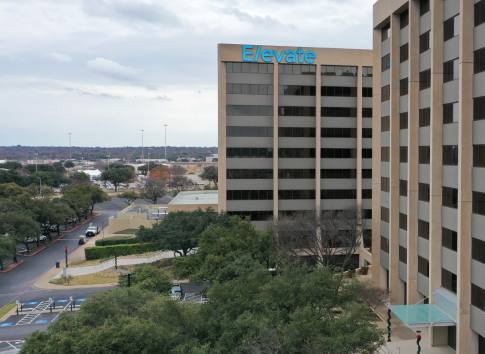
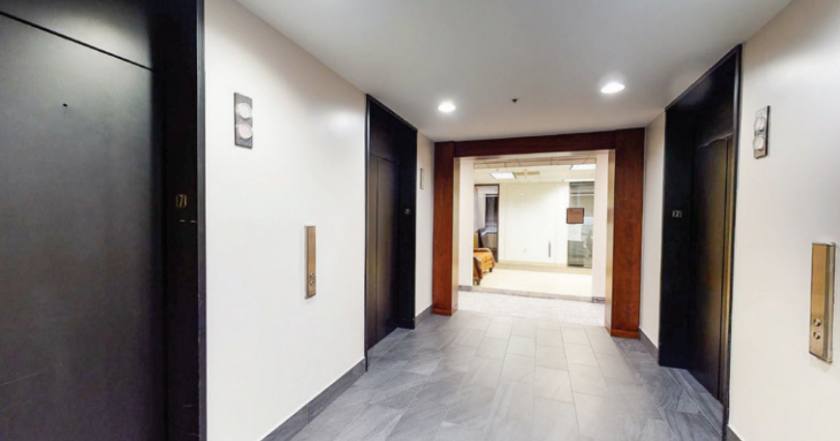
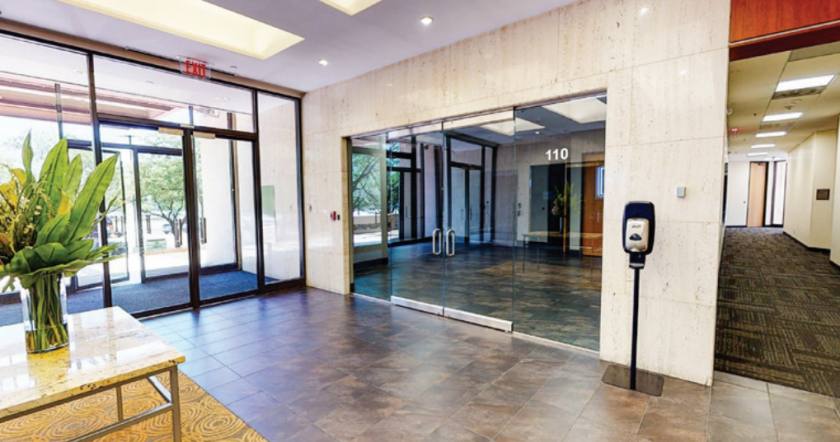
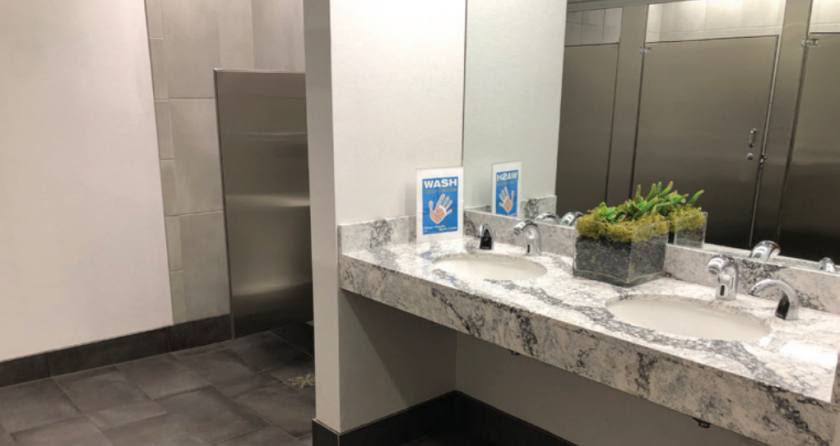
Additional Photos
Listing Agents

Jake Neal
O: 817-710-1112
M: 817-606-7820
jneal@holtlunsford.com
O: 817-710-1112
M: 817-606-7820
jneal@holtlunsford.com
While we strive to provide the most accurate information, all listing information, and demographic data, is provided by third-parties. As such, MyEListing will not be responsible for the accuracy of the information. It is strongly recommended that you verify all information with the listing agent, and any relevant agencies, prior to making any decisions.