Flex-Office-Warehouse
10806 West State Highway 29 Liberty Hill, TX 78642
10806 West State Highway 29 Liberty Hill, TX 78642

Details & Description
Property Highlights
• Land can be divided and structures rented separately
• Highway 29 frontage
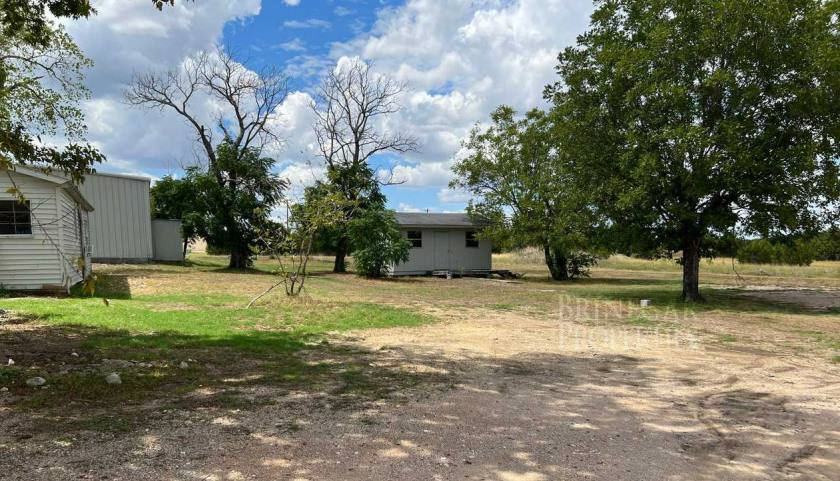
Additional Photos


Listing Agents

Megan Ford
O: 512-940-0188
M: 512-645-2908
megan@512texas.com
O: 512-940-0188
M: 512-645-2908
megan@512texas.com
While we strive to provide the most accurate information, all listing information, and demographic data, is provided by third-parties. As such, MyEListing will not be responsible for the accuracy of the information. It is strongly recommended that you verify all information with the listing agent, and any relevant agencies, prior to making any decisions.


