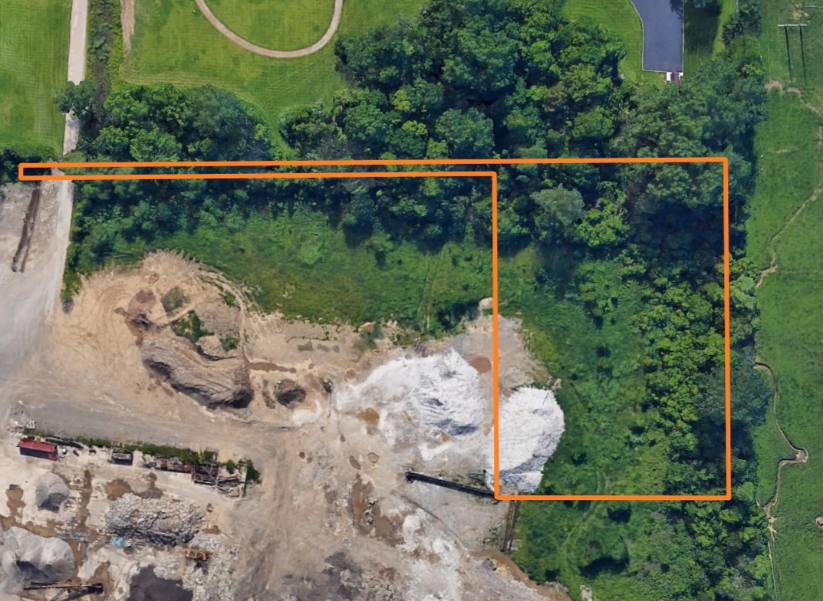
1-Mile | 3-Miles | 5-Miles | ||
---|---|---|---|---|
Total Population | 6,731 | 39,999 | 65,325 | |
Population Median Age | 37 | 37 | 40 | |
Population by Age | 0-9 Yrs | 427 (6%) | 5097 (12%) | 7412 (11%) |
10-19 Yrs | 162 (2%) | 4311 (10%) | 7274 (11%) | |
20-29 Yrs | 1914 (28%) | 7300 (18%) | 10400 (15%) | |
30-39 Yrs | 1731 (25%) | 5532 (13%) | 8215 (12%) | |
40-49 Yrs | 1106 (16%) | 5008 (12%) | 7928 (12%) | |
50-59 Yrs | 713 (10%) | 5376 (13%) | 8414 (12%) | |
60-69 Yrs | 460 (6%) | 4161 (10%) | 7914 (12%) | |
70+ Yrs | 219 (3%) | 3216 (8%) | 7766 (11%) | |
Median HH Income | $37,020 | $35,046 | $39,510 | |
Total Household Income | < 24K | 401 (40%) | 5694 (38%) | 8238 (31%) |
25-49K | 239 (24%) | 4019 (27%) | 7632 (29%) | |
50-74K | 280 (28%) | 2830 (19%) | 4832 (18%) | |
75-99K | 32 (3%) | 1146 (7%) | 2655 (10%) | |
100-199K | 29 (2%) | 1030 (6%) | 2499 (9%) | |
200K+ | 2 (0%) | 119 (0%) | 351 (1%) | |
Highest Education Level | No Diploma | 1405 | 4677 | 6451 |
Diploma or GED | 2031 | 11546 | 18753 | |
Some College | 1291 | 5917 | 9903 | |
Assoc. Degree | 390 | 2315 | 3959 | |
Bachelors Degree | 147 | 1830 | 4348 | |
Higher Degree | 35 | 780 | 2068 | |
Total Housing Units | 1,194 | 17,517 | 29,745 | |
--Owner-Occupied | 467 | 7,637 | 14,991 | |
--Renter-Occupied | 517 | 7,202 | 11,216 | |
Owner-Occupied Values | < 100K | 434 | 6035 | 8717 |
100-199K | 26 | 1349 | 5061 | |
200-299K | 4 | 154 | 764 | |
300-399K | 1 | 54 | 199 | |
400-499K | 0 | 2 | 67 | |
500K+ | 1 | 43 | 183 | |
Total Working Age Population | 6,229 | 32,254 | 53,569 | |
In Work Force | 1,033 | 15,658 | 27,885 | |
Not In Work Force | 5,196 | 16,596 | 25,684 | |
Workforce Employed | 927 | 13,939 | 25,496 | |
Workforce Unemployed | 106 | 1,702 | 2,347 | |
Civlian Workforce | 1,033 | 15,640 | 27,843 | |
Military Workforce | 0 | 18 | 42 | |
Total Households | 983 | 14,839 | 26,207 | |
Family Households | 491 | 8,014 | 14,455 | |
Non-Family Households | 493 | 6,824 | 11,751 | |
Married Couple | 223 | 4,255 | 9,187 | |
Other Family | 267 | 3,759 | 5,268 | |
Married w/Child | 55 | 1,346 | 2,718 | |
Single Male w/Child | 11 | 371 | 525 | |
Single Female w/Child | 135 | 1,668 | 2,294 |
Population Change Last Two Decades - Plus Projection
2000 | % | 2010 | % | 2020 | % | 2030 | |
---|---|---|---|---|---|---|---|
Ohio | 11,353,140 | +2 | 11,536,504 | 0 | 11,574,870 | 0 | 11,615,100 |
Richland County | 128,852 | -3 | 124,475 | -3 | 120,200 | -3 | 116,640 |
Total Working Age Population:
Total Households:
Total Working Age Population:
Total Households:
Total Working Age Population:
Total Households: