Retail Space
12189 New York 16 Chaffee, NY 14030
12189 New York 16 Chaffee, NY 14030

Details & Description
Property Highlights
- • Excellent Location
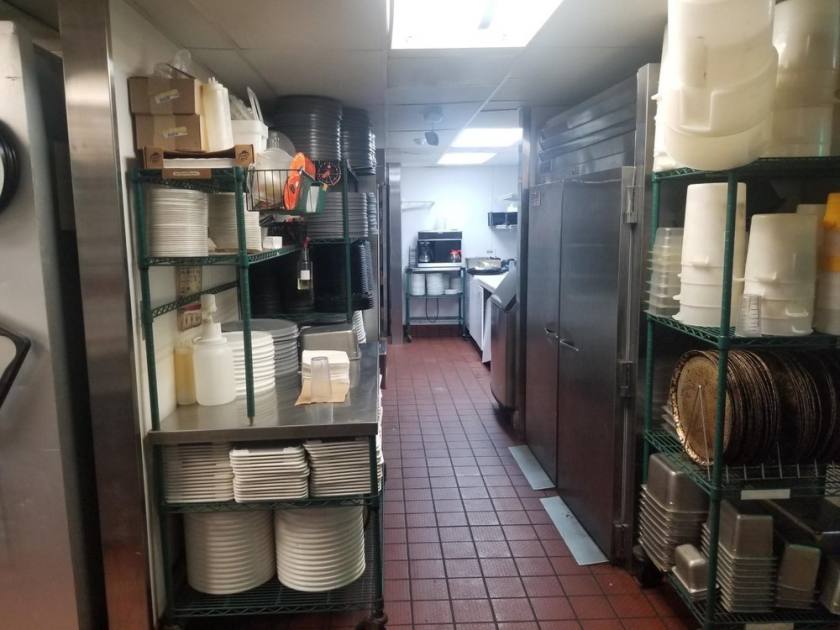
- • Former Pizza Hut
- • 2,250 +/- SF Available
- • Ample Parking
- • Larger Anchor Tenants in Yorkshire Plaza
Additional Photos


Listing Agents

Rick Recckio
O: 716-631-5555
M: 716-998-4422
rick@recckio.com
O: 716-631-5555
M: 716-998-4422
rick@recckio.com
While we strive to provide the most accurate information, all listing information, and demographic data, is provided by third-parties. As such, MyEListing will not be responsible for the accuracy of the information. It is strongly recommended that you verify all information with the listing agent, and any relevant agencies, prior to making any decisions.


