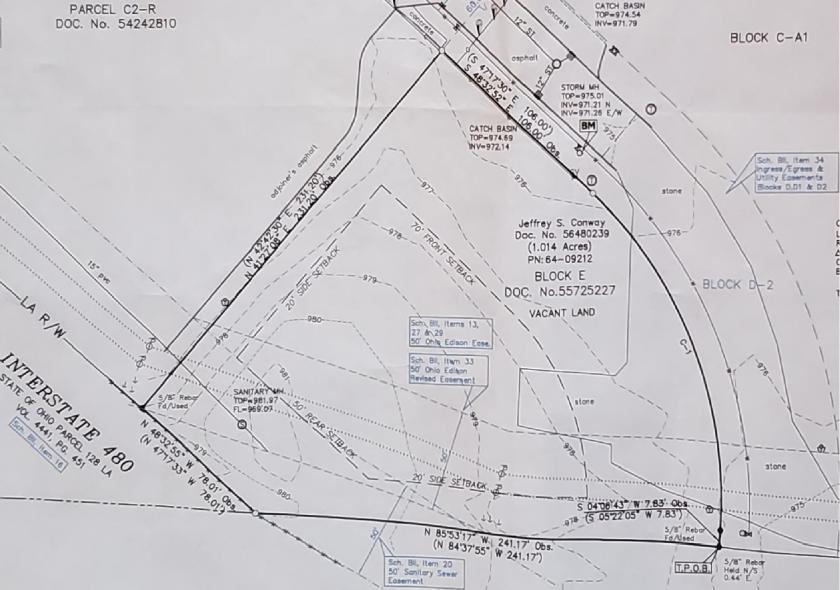
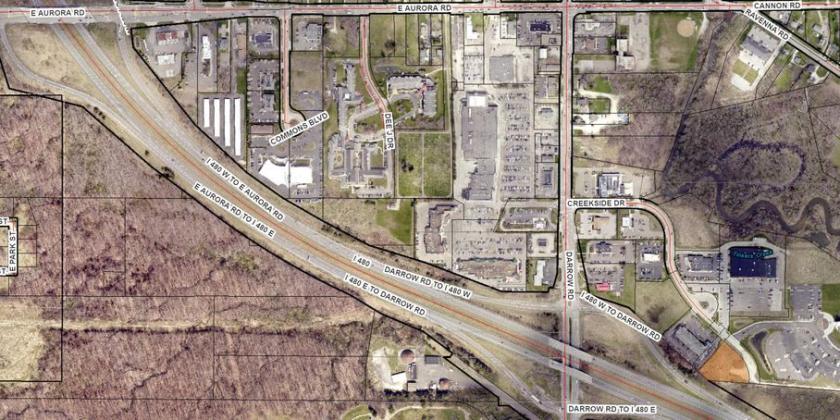
Commercial Land
Creekside Drive Twinsburg, OH 44087
Creekside Drive Twinsburg, OH 44087
Details & Description
Property Highlights
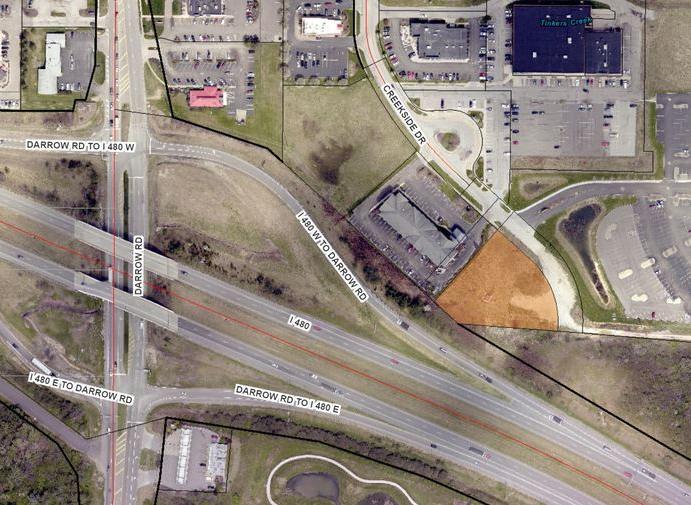
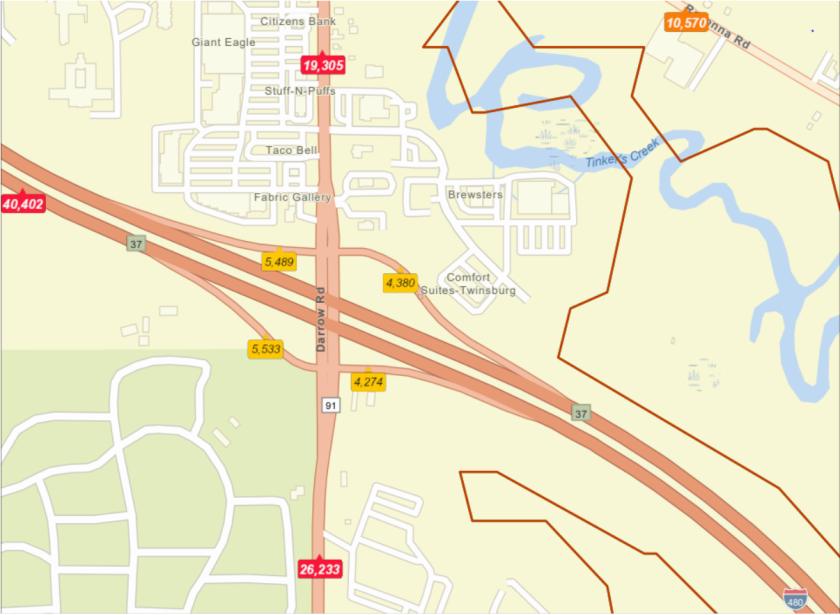
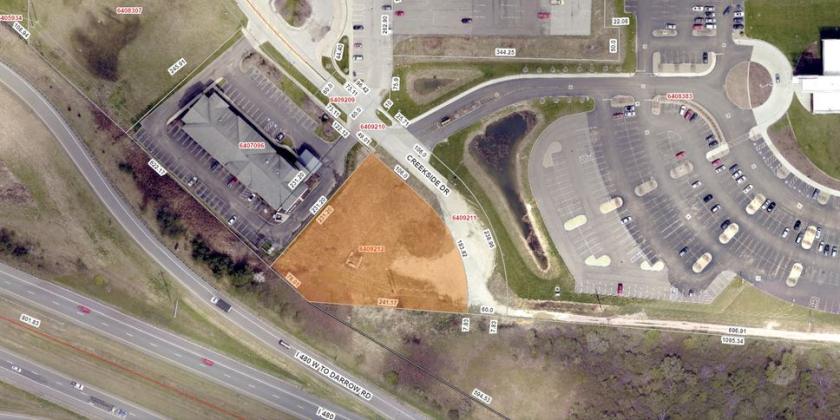
- • Great Highway Accessibility
- • Water/Sewer Available
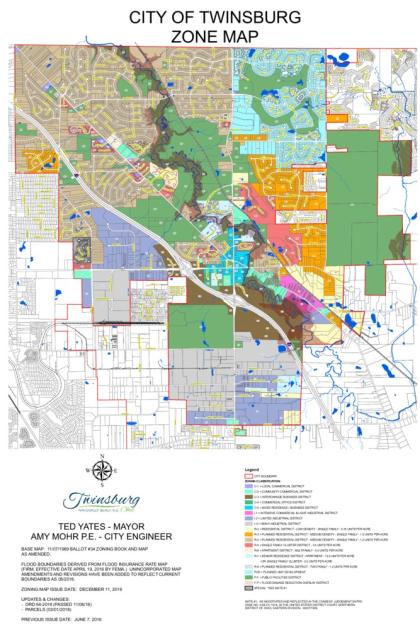
- • Zoned C-3 Interchange Business District
- • Utilities Available
Additional Photos
Listing Agents

Brad Weidman
O: 234-231-6251
M: 330-466-8550
brad.weidman@svn.com
O: 234-231-6251
M: 330-466-8550
brad.weidman@svn.com

Aaron Davis
O: 234-231-0285
M: 330-221-7297
aaron.davis@svn.com
O: 234-231-0285
M: 330-221-7297
aaron.davis@svn.com
While we strive to provide the most accurate information, all listing information, and demographic data, is provided by third-parties. As such, MyEListing will not be responsible for the accuracy of the information. It is strongly recommended that you verify all information with the listing agent, and any relevant agencies, prior to making any decisions.