Commercial Land
855 Mayfield Road Grand Prairie, TX 75052
855 Mayfield Road Grand Prairie, TX 75052

Details & Description
Property Highlights
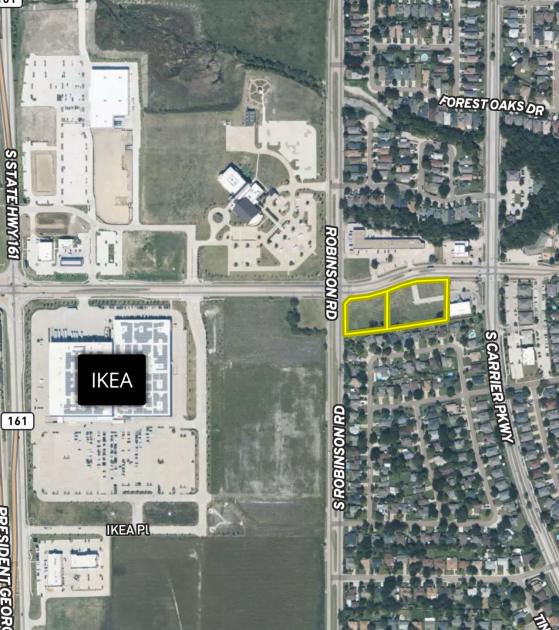
- • Shadow Anchored By IKEA
- • Bass Pro Shops and Andretti Carting coming soon
- • utilities to site
- • signalized intersection
- • Left In/out access
Listing Agents

Mike Browning
M: 214-354-3583
mike@browningre.com
M: 214-354-3583
mike@browningre.com
While we strive to provide the most accurate information, all listing information, and demographic data, is provided by third-parties. As such, MyEListing will not be responsible for the accuracy of the information. It is strongly recommended that you verify all information with the listing agent, and any relevant agencies, prior to making any decisions.