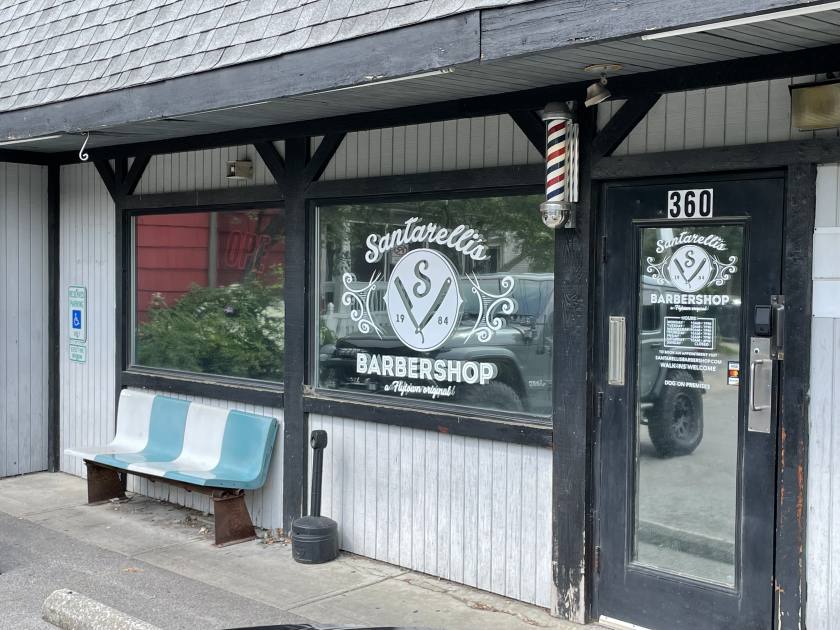
Retail Space
360 West 3rd Avenue Columbus, OH 43201
360 West 3rd Avenue Columbus, OH 43201

Details & Description
Property Highlights
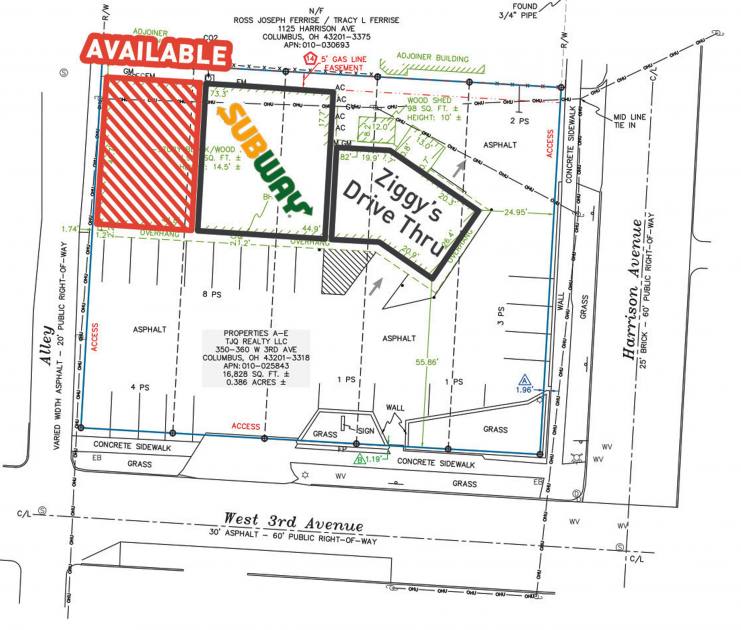
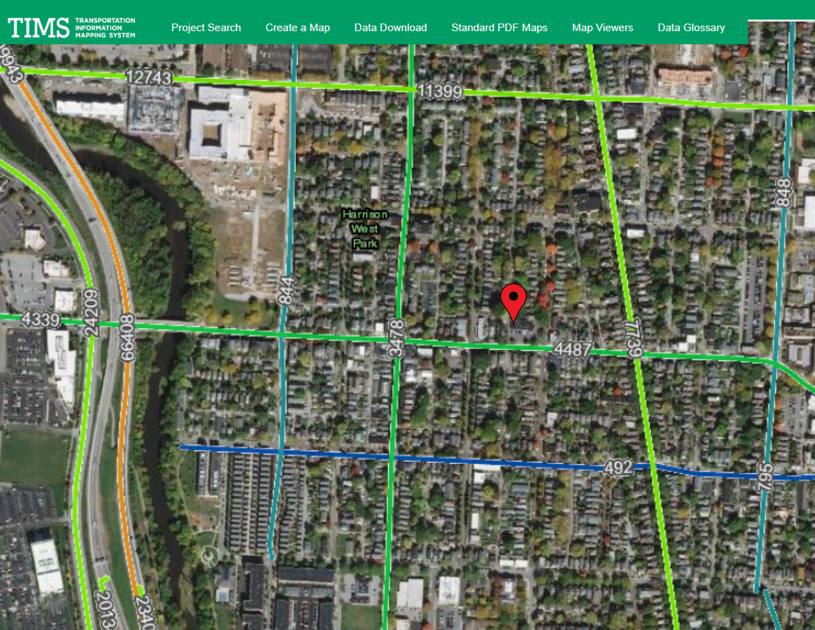
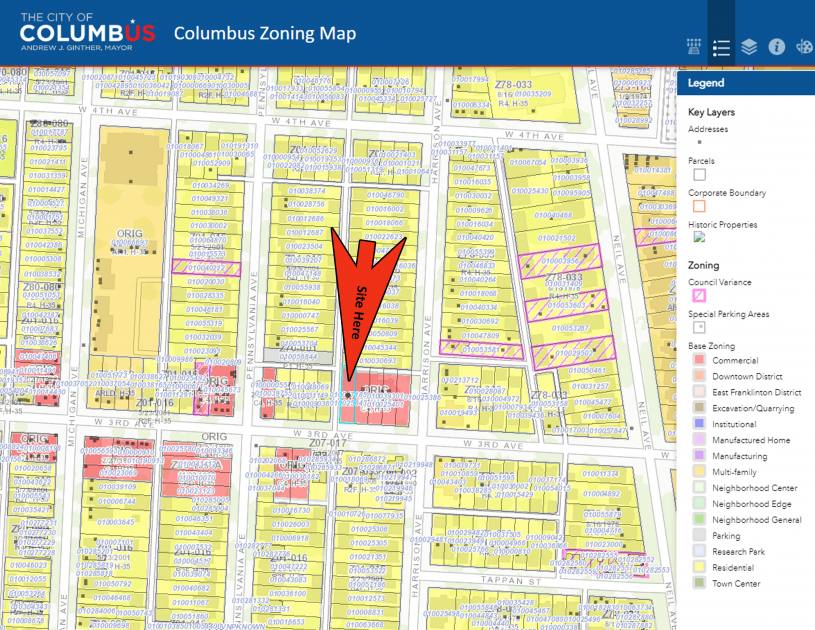
- • Great location in the middle of Harrison West
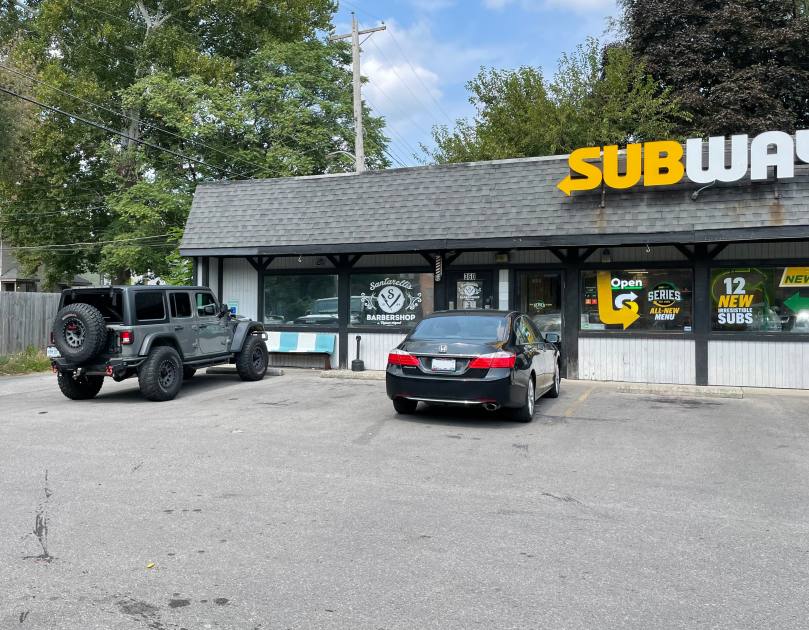
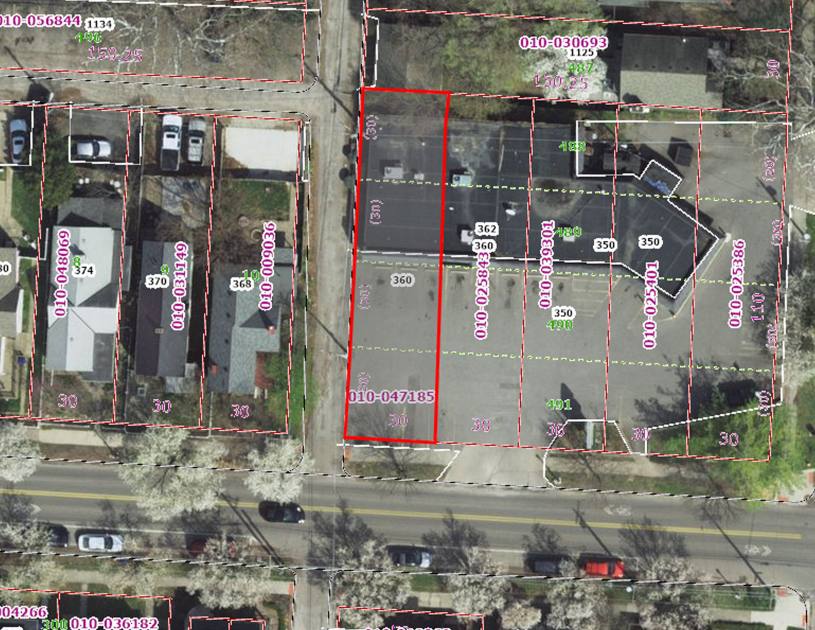
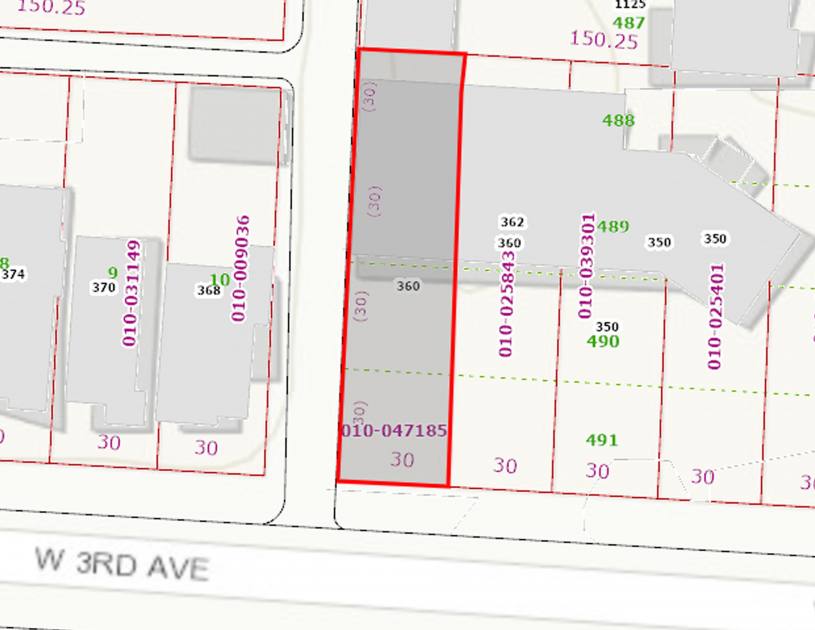
- • Easy access with ample parking
- • Close to High Street and Short North Arts District
Additional Photos
Listing Agents

Julie Cohen
O: 614-221-4286
M: 614-643-2654
jcohen@rweiler.com
O: 614-221-4286
M: 614-643-2654
jcohen@rweiler.com
While we strive to provide the most accurate information, all listing information, and demographic data, is provided by third-parties. As such, MyEListing will not be responsible for the accuracy of the information. It is strongly recommended that you verify all information with the listing agent, and any relevant agencies, prior to making any decisions.