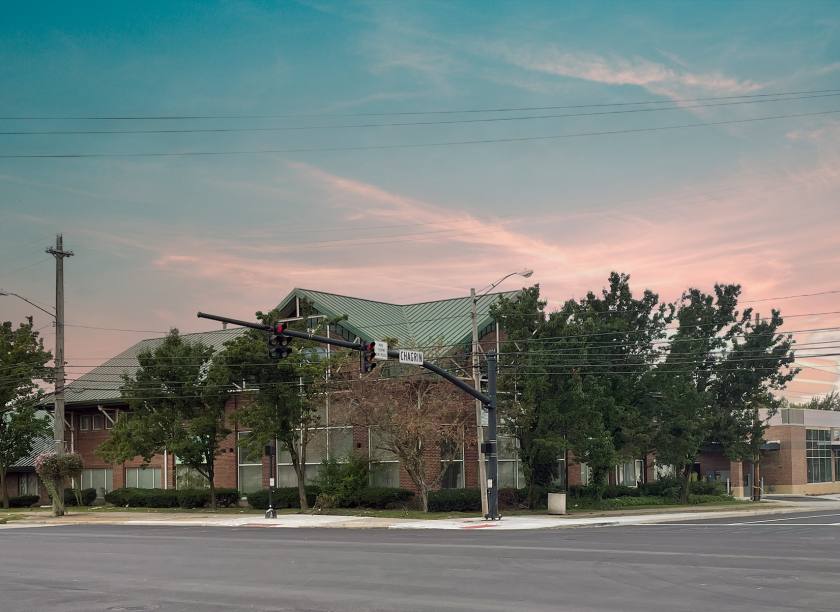
Office Space
16500 Chagrin Boulevard Shaker Heights, OH 44120
16500 Chagrin Boulevard Shaker Heights, OH 44120
Details & Description
Property Highlights
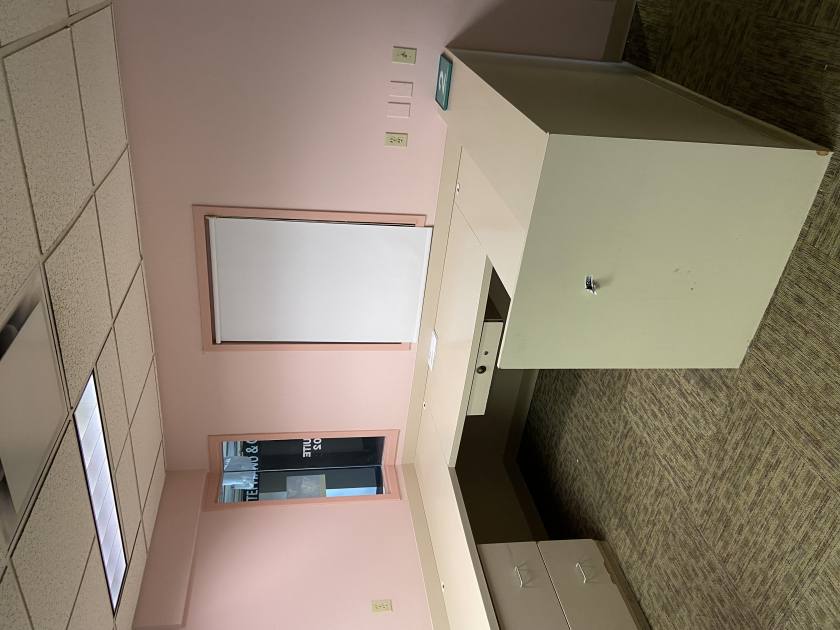
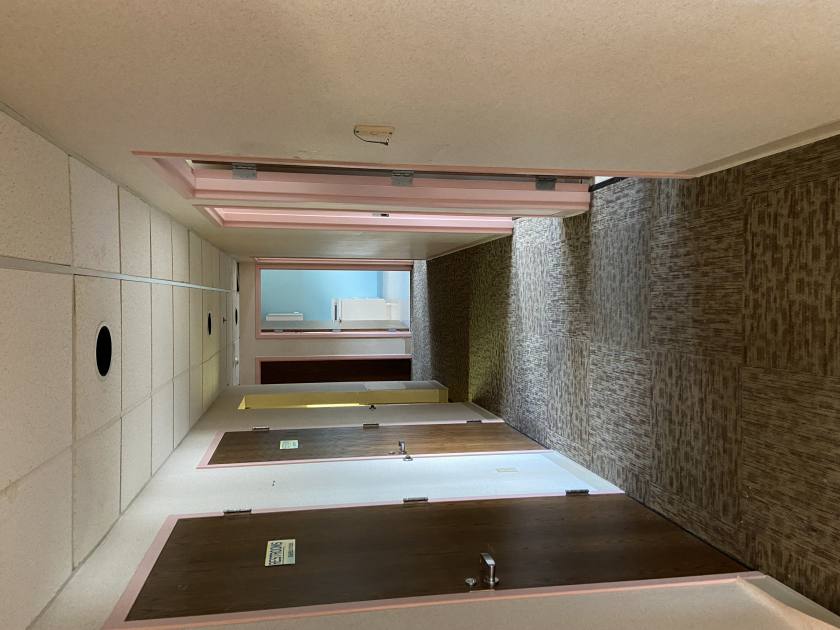
• Suite 202/2,376 SF - Medical Office Space with private entryway, 5 exam rooms
• Suite 202/2,376 SF - Medical Office Space with private entryway, 5 exam rooms
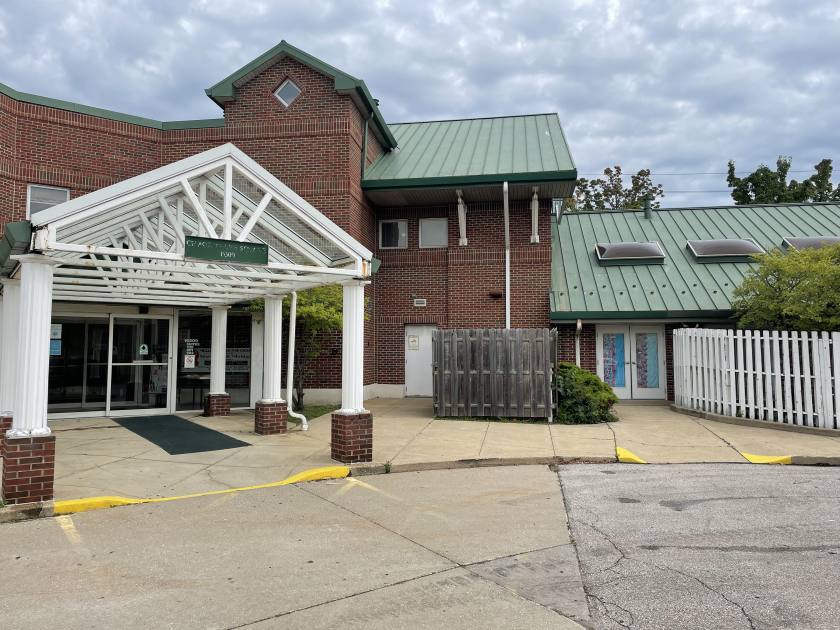
Additional Photos

Listing Agents

Noah Broadbent
O: 330-239-0176
noah.broadbent@naipvc.com
O: 330-239-0176
noah.broadbent@naipvc.com

Joe Hauman
O: 330-239-0176
joe.hauman@naipvc.com
O: 330-239-0176
joe.hauman@naipvc.com
While we strive to provide the most accurate information, all listing information, and demographic data, is provided by third-parties. As such, MyEListing will not be responsible for the accuracy of the information. It is strongly recommended that you verify all information with the listing agent, and any relevant agencies, prior to making any decisions.


