Office Space
2005 Market Street Philadelphia, PA 19103
2005 Market Street Philadelphia, PA 19103
Details & Description
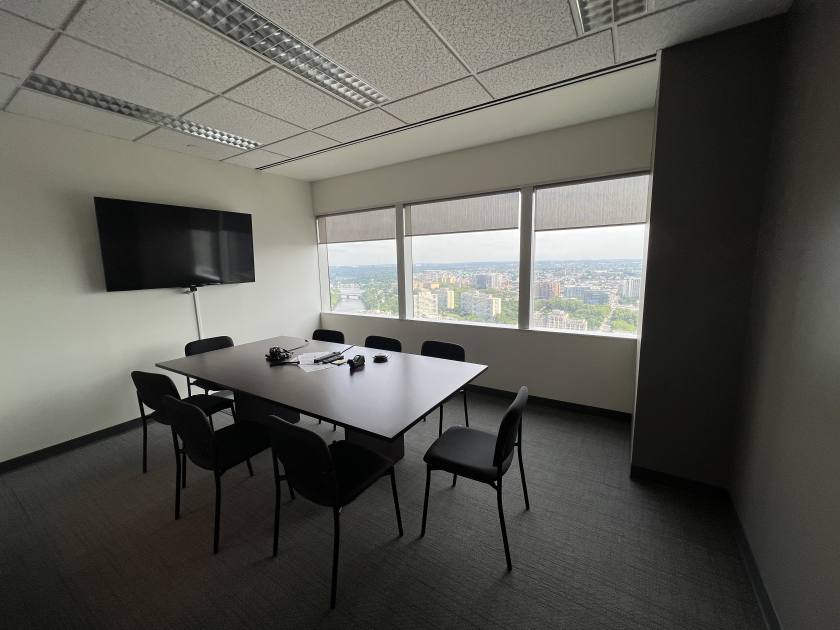
Property Highlights
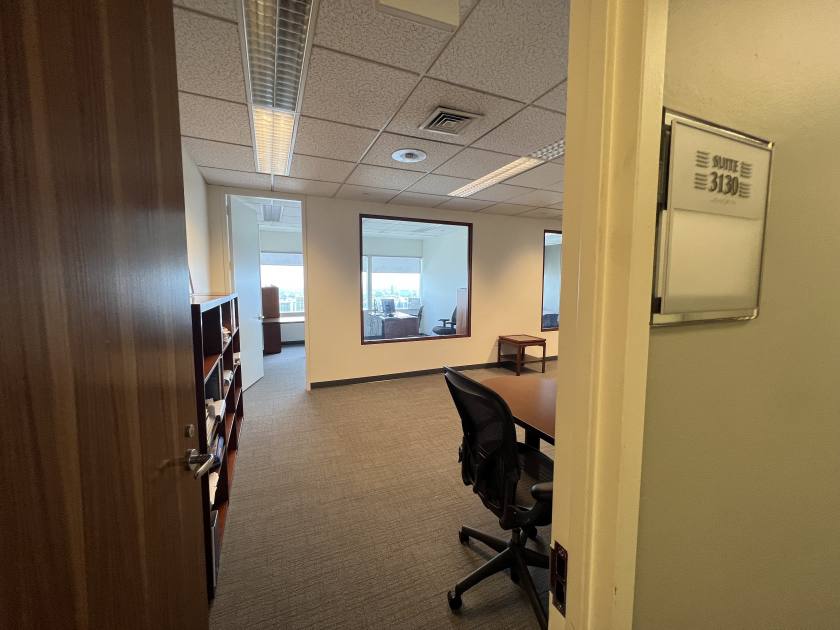
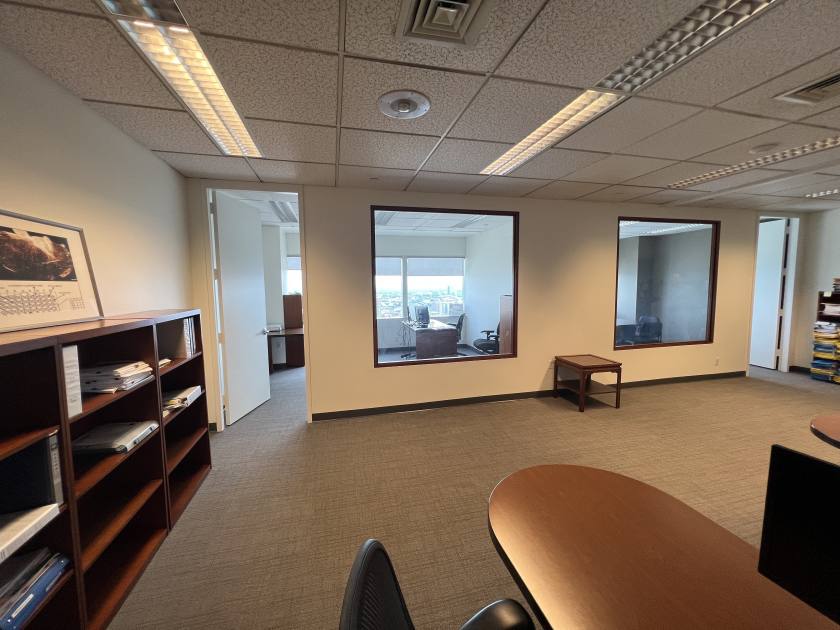
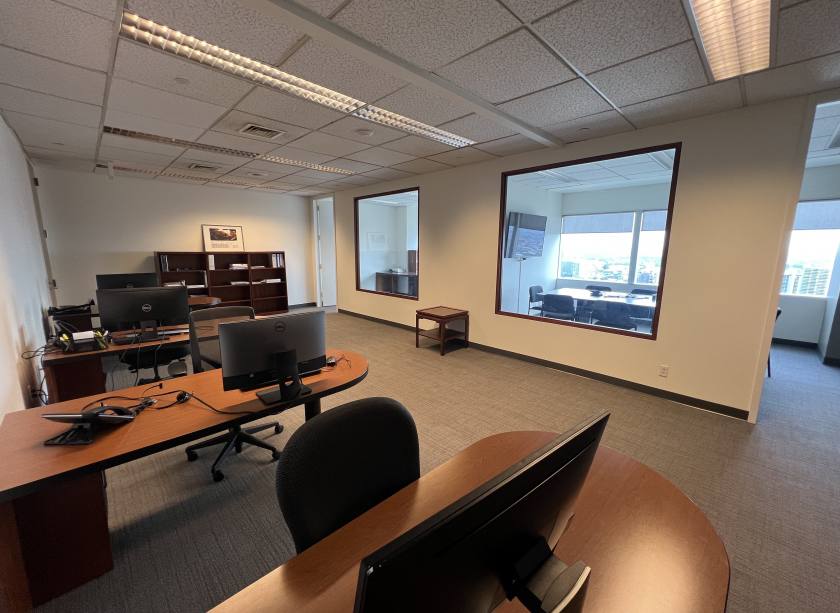
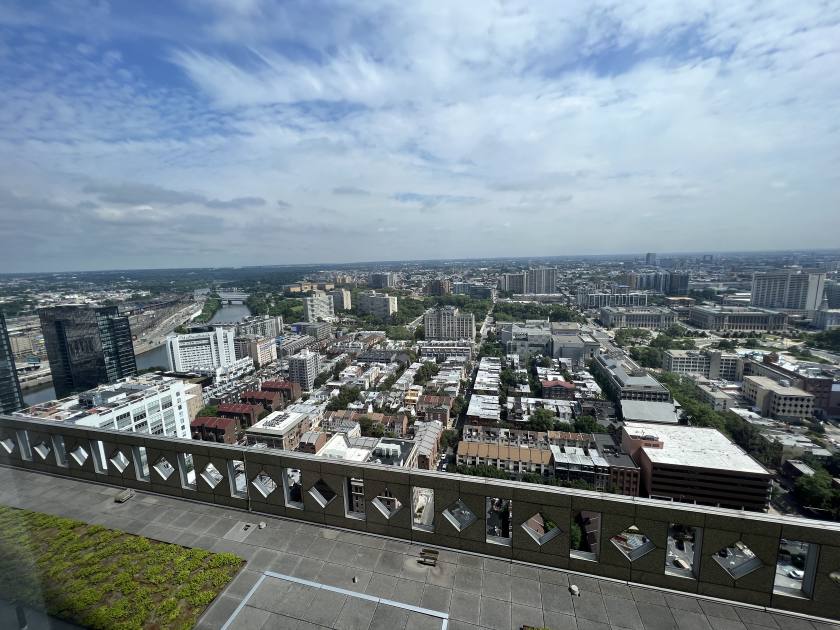
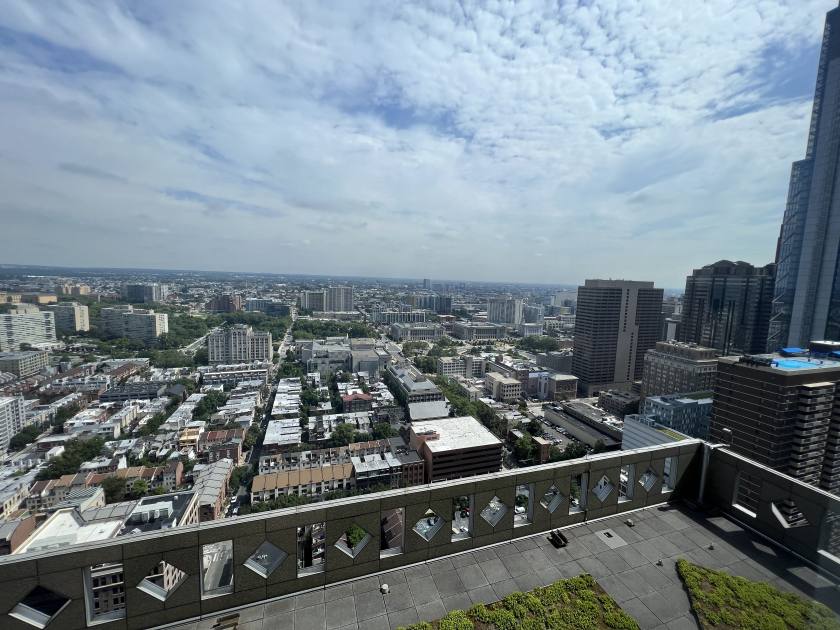
- • Magnificent view on the 31st floor
- • Fully furnished
- • Expires September 2028
- • On-site security
Additional Photos

Listing Agents

Mitchell Fox
O: 215-568-8000
mitchfox@msfoxre.com
O: 215-568-8000
mitchfox@msfoxre.com
While we strive to provide the most accurate information, all listing information, and demographic data, is provided by third-parties. As such, MyEListing will not be responsible for the accuracy of the information. It is strongly recommended that you verify all information with the listing agent, and any relevant agencies, prior to making any decisions.