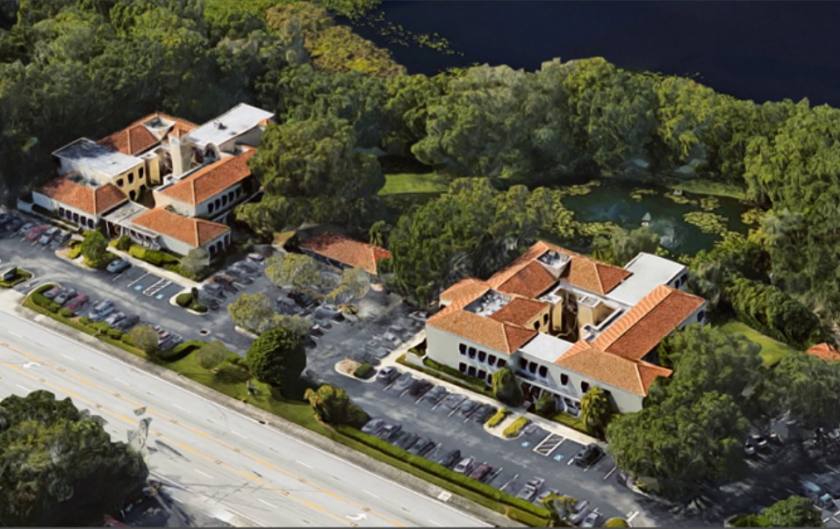
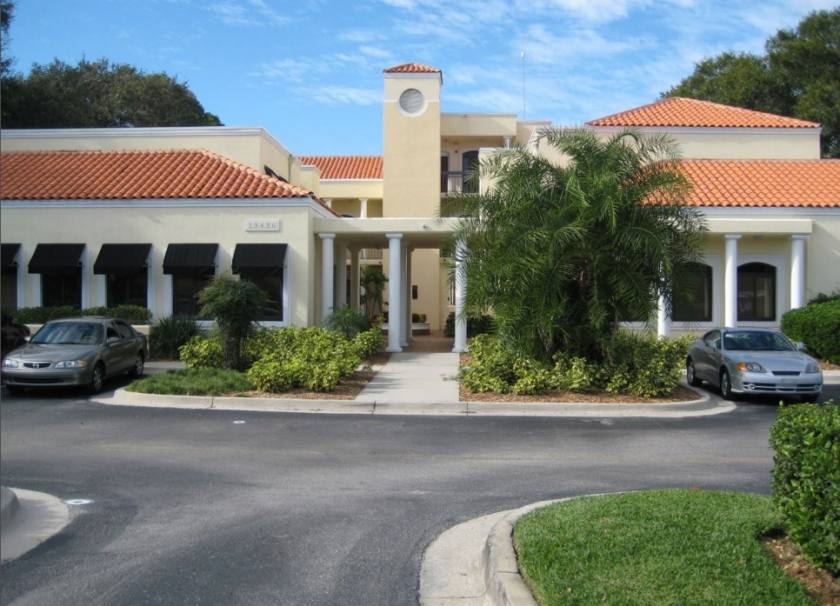
Office Space
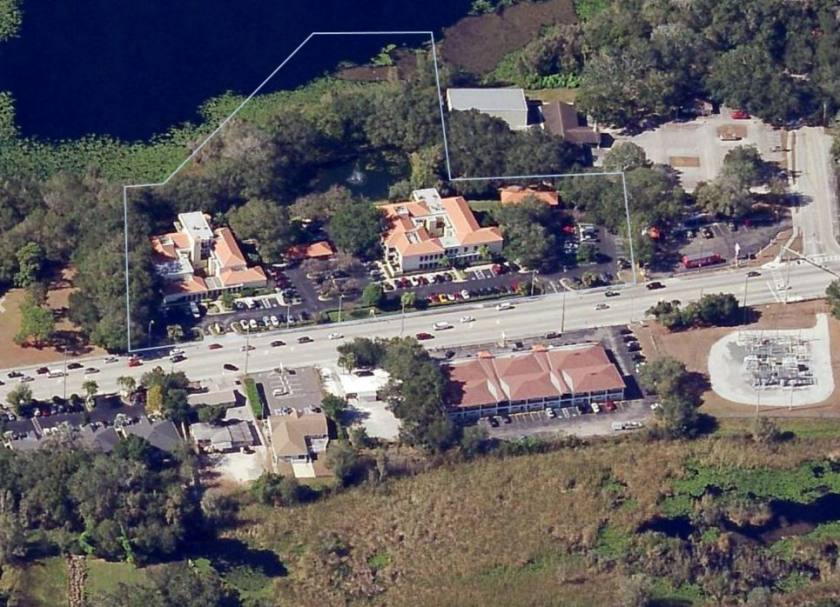
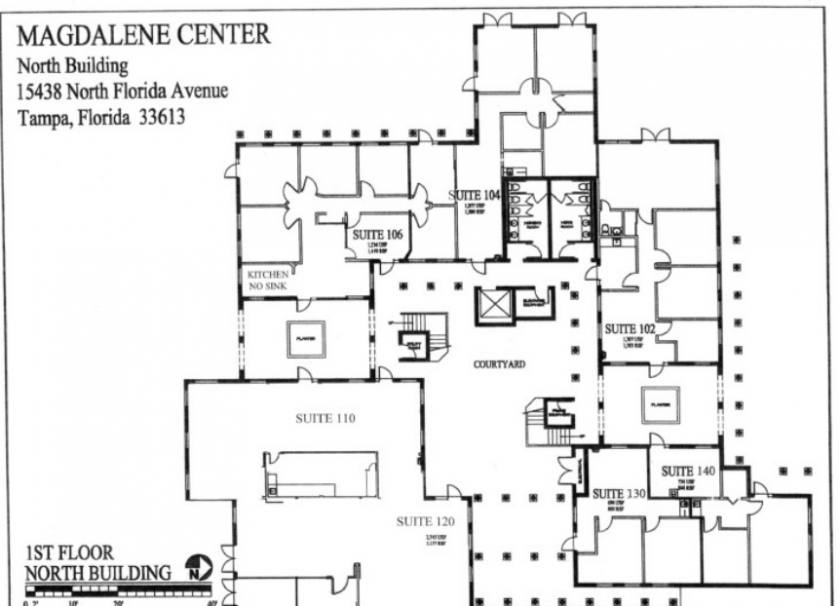
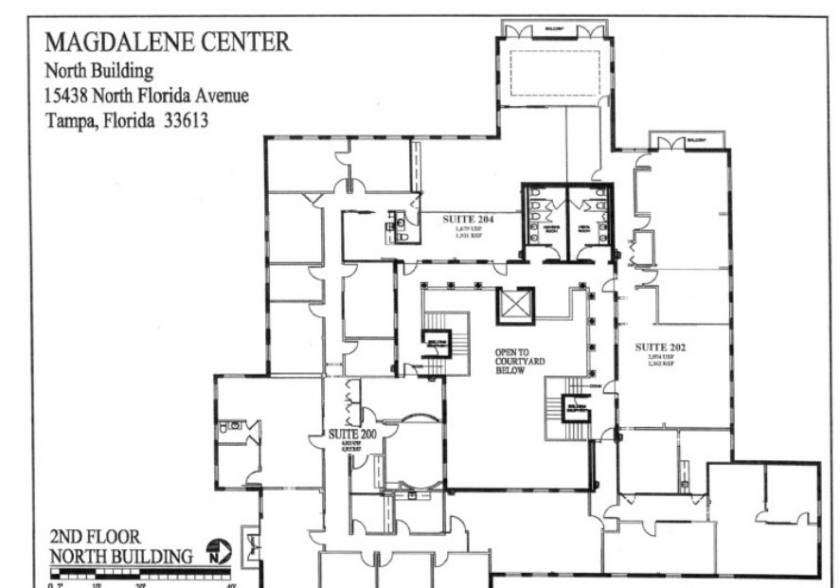
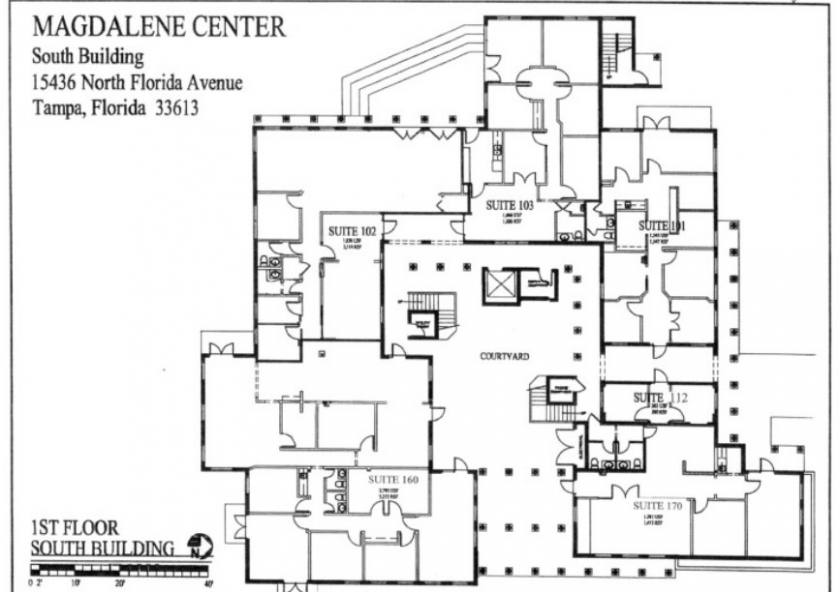
15436 - 15438 N Florida Ave Tampa, FL 33613
15436 - 15438 N Florida Ave Tampa, FL 33613
Details & Description
Property Highlights
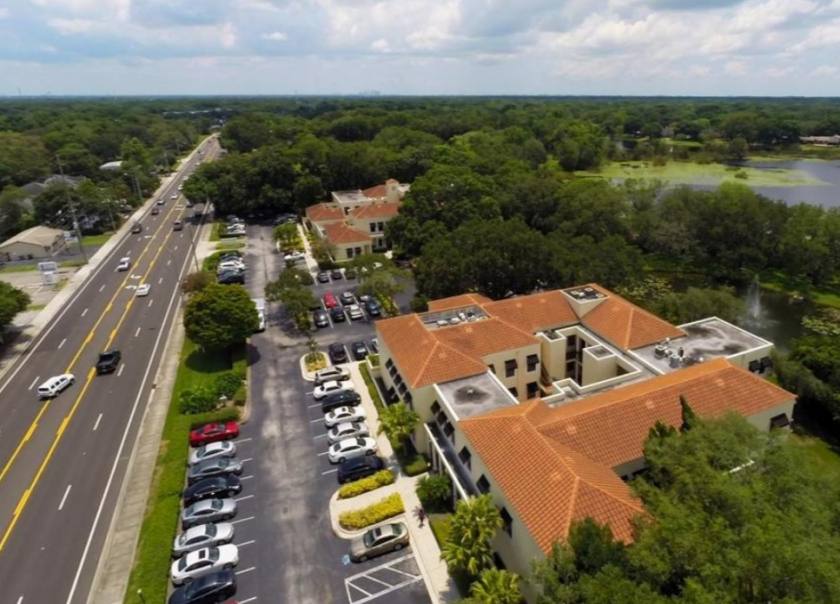
• Over 221,000 Residents In 5 Mile Radius, Including Avila Golf & Country Club And High Income Carrollwood/Lake Magda
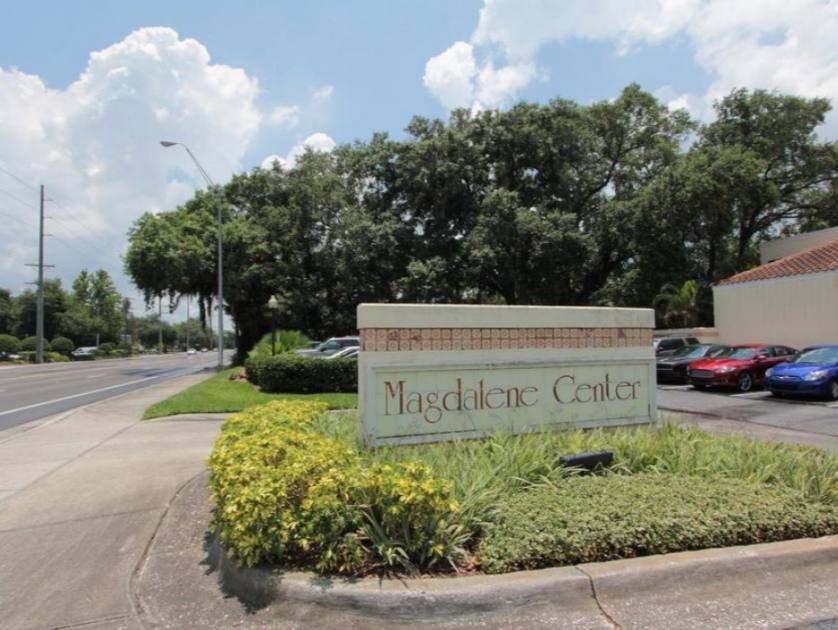
• Highly desirable Tampa submarket of Lake Magdalene in NW Tampa
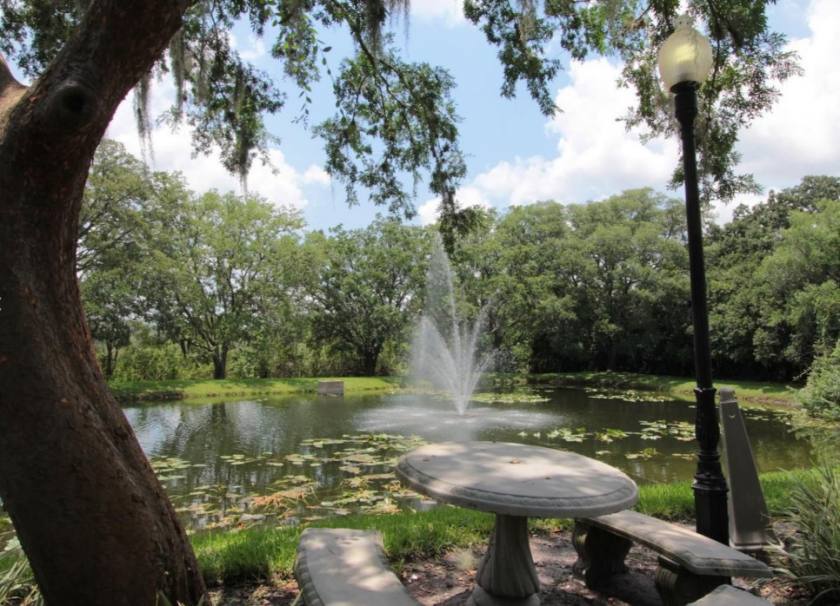
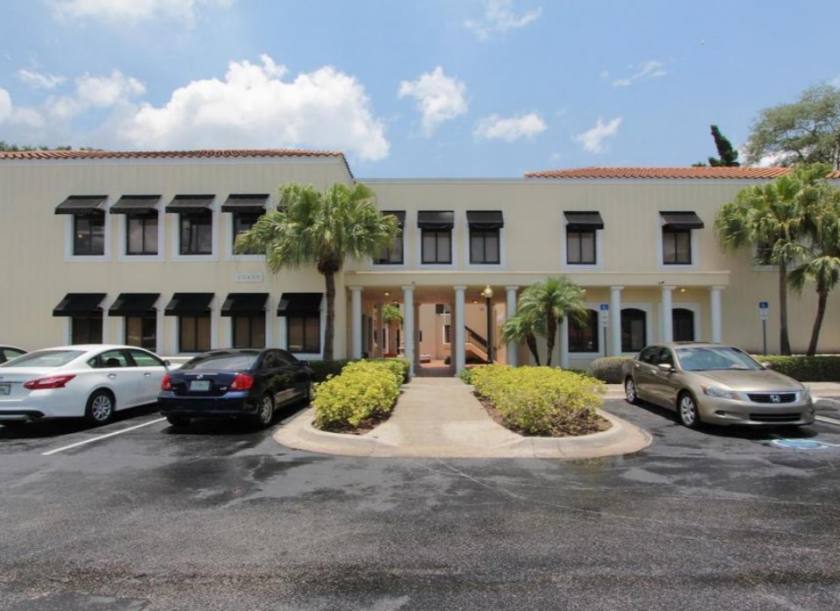
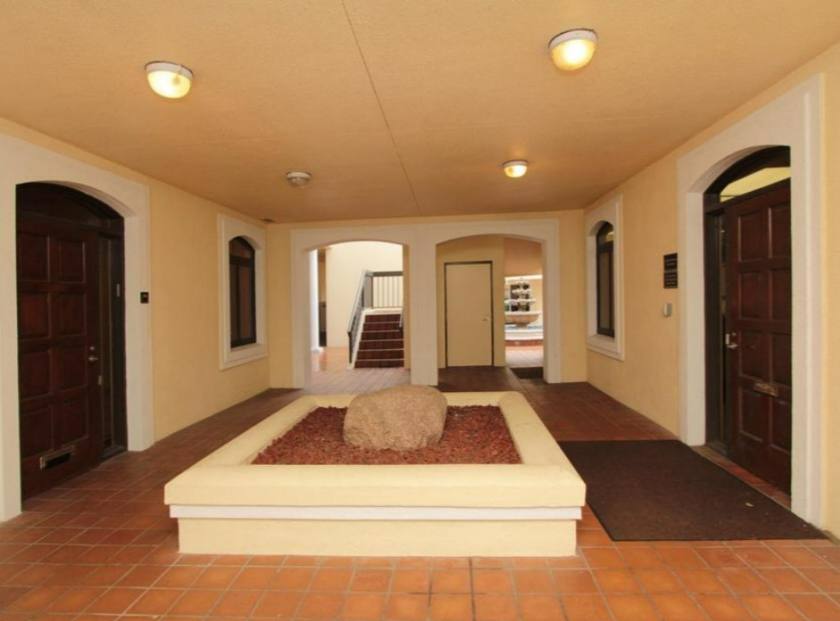
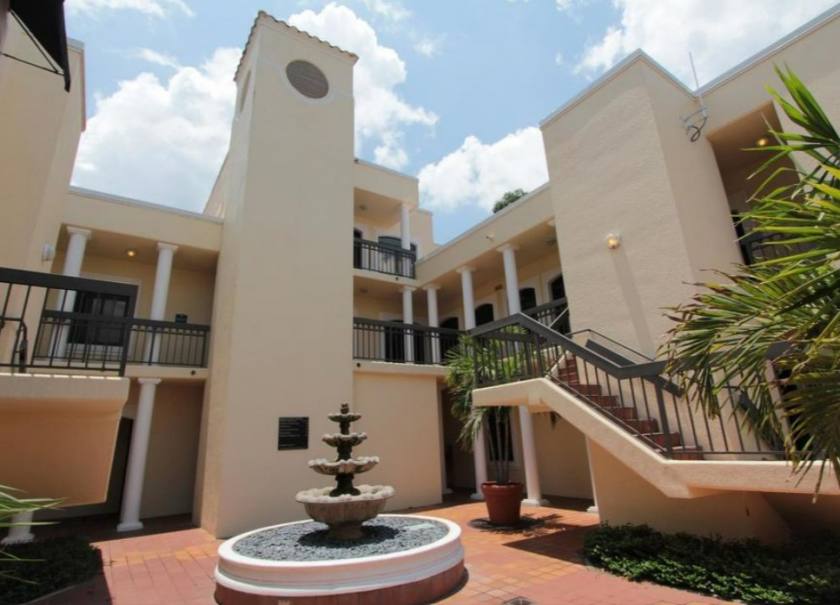
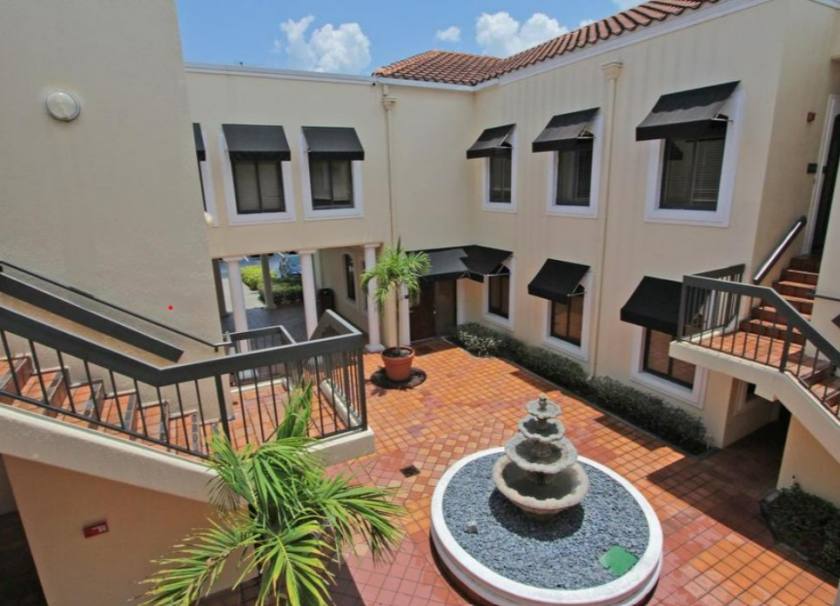
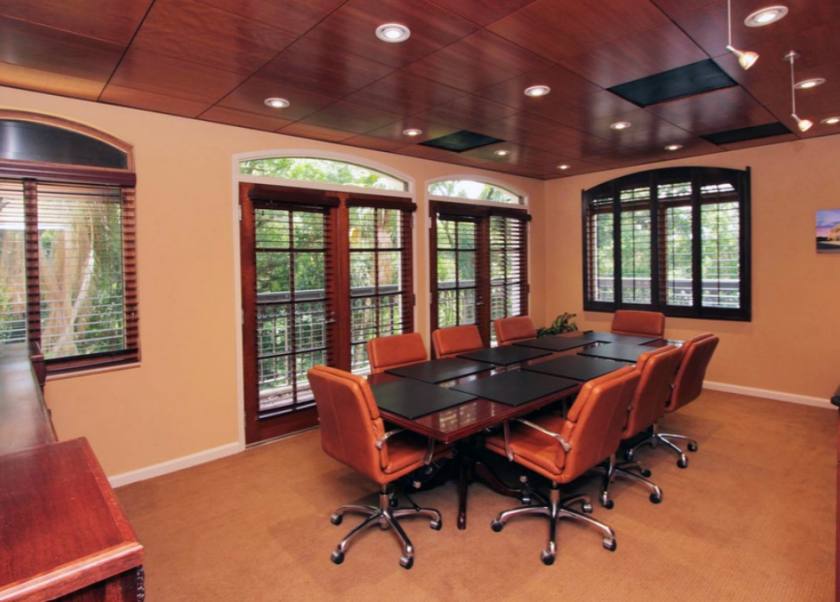
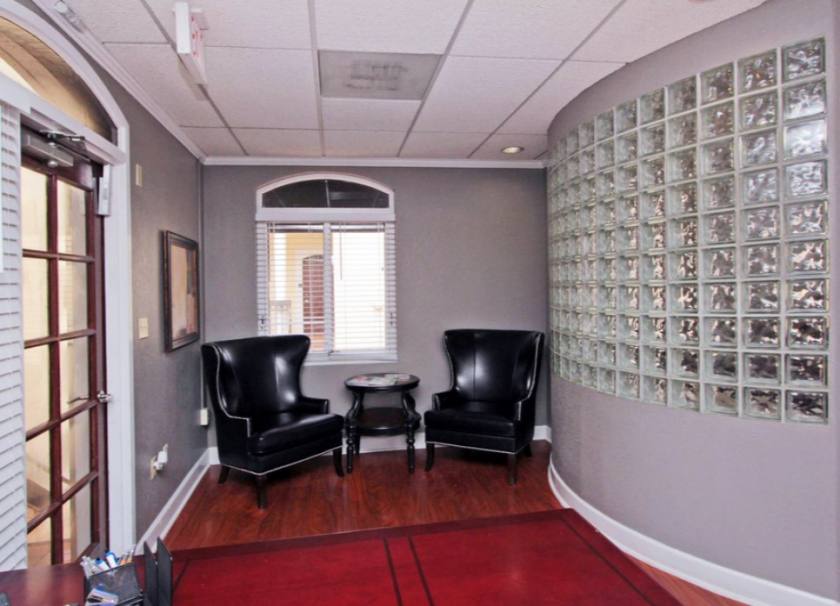
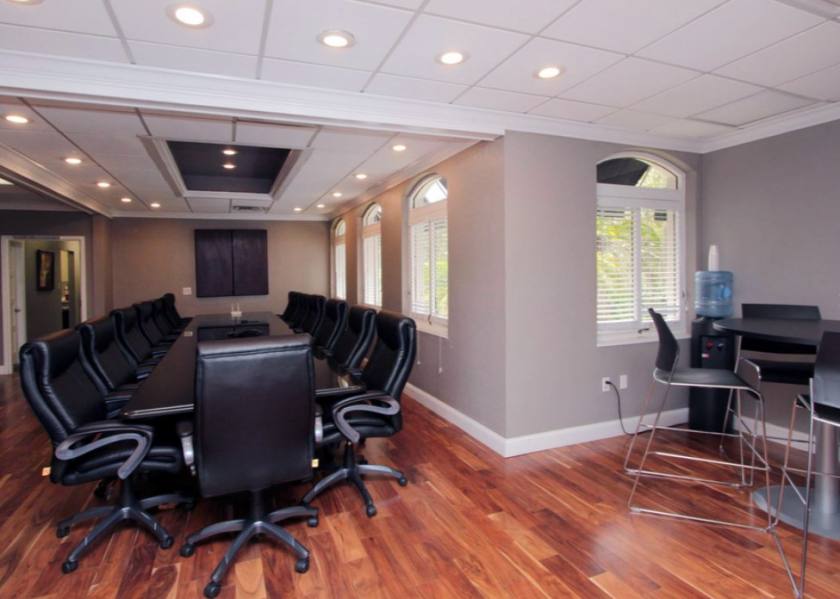
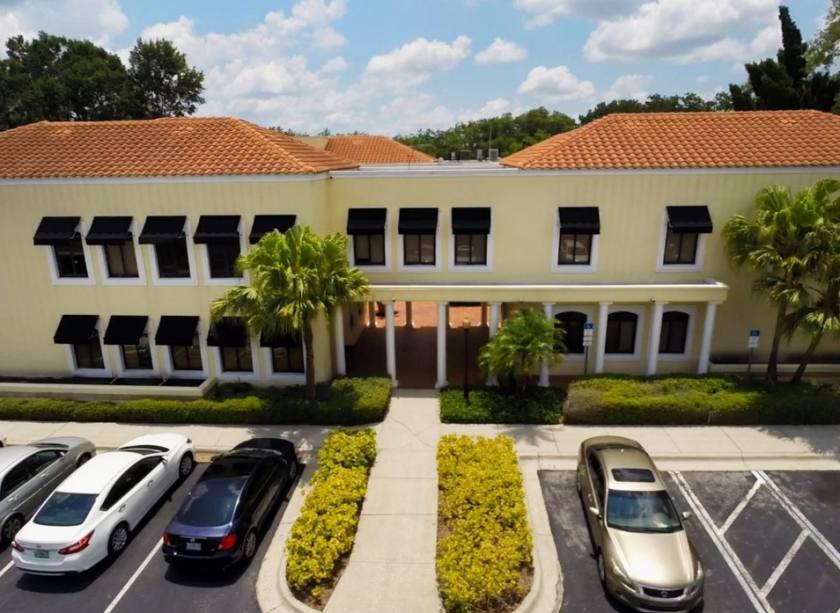
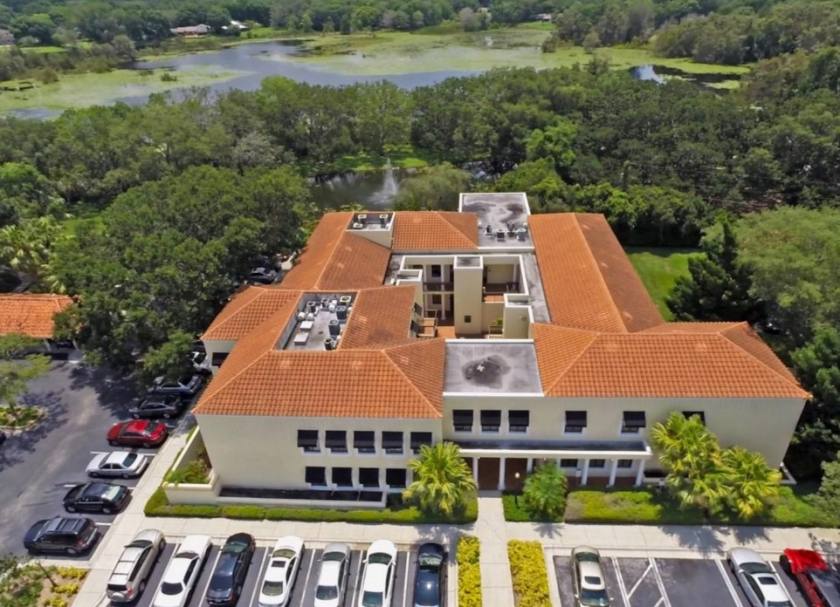
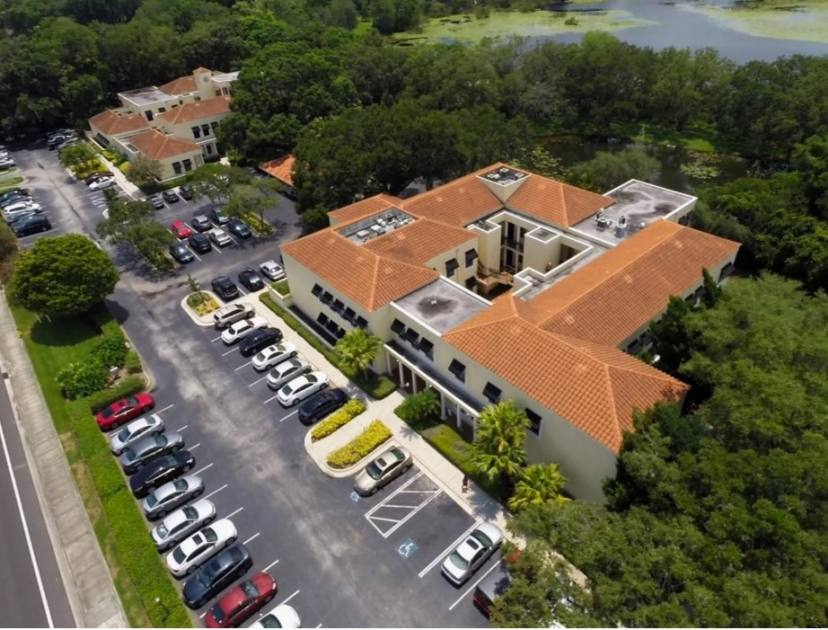
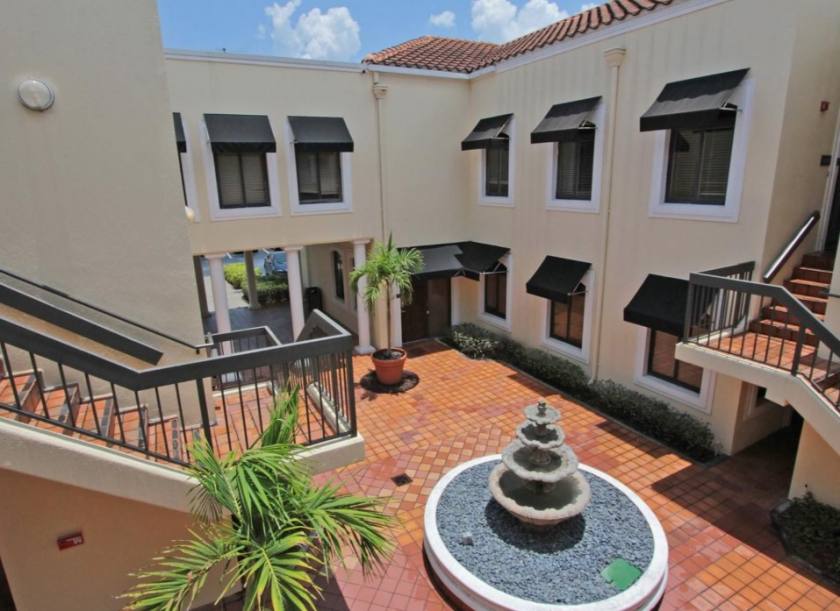
Additional Photos
Listing Agents

Kari Grimaldi
O: 813-882-0884
M: 813-928-3733
kari@grimaldicommercialrealty.com
O: 813-882-0884
M: 813-928-3733
kari@grimaldicommercialrealty.com
While we strive to provide the most accurate information, all listing information, and demographic data, is provided by third-parties. As such, MyEListing will not be responsible for the accuracy of the information. It is strongly recommended that you verify all information with the listing agent, and any relevant agencies, prior to making any decisions.