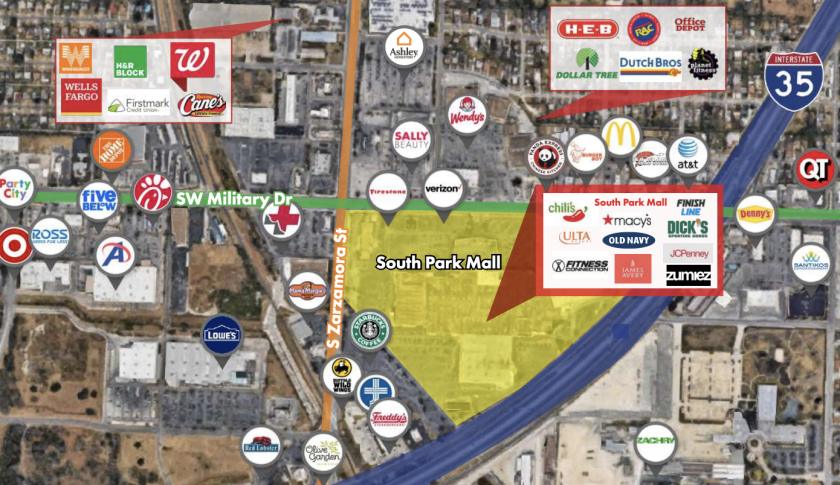
Located at the Intersection of I-35 and SW Military Drive
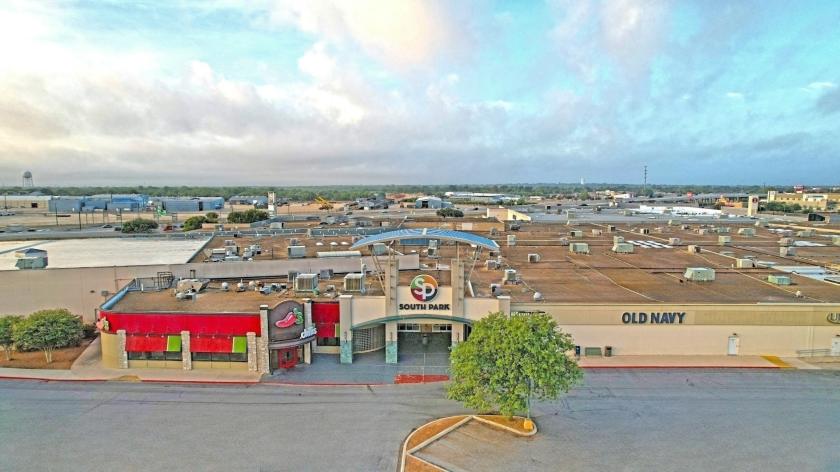
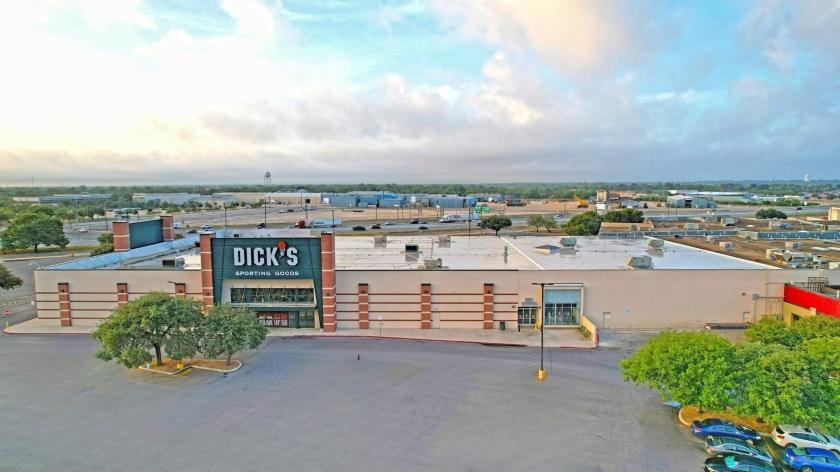
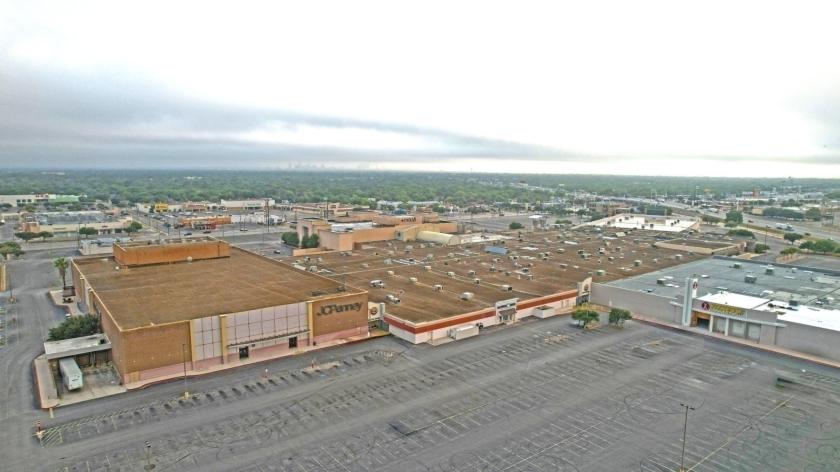
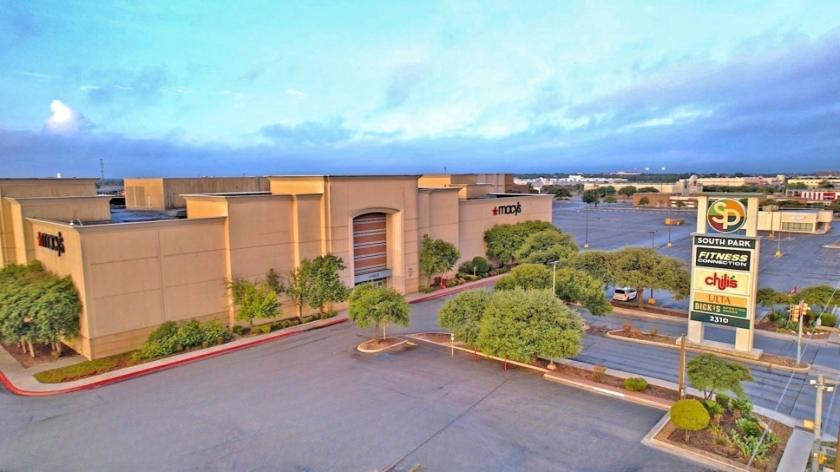
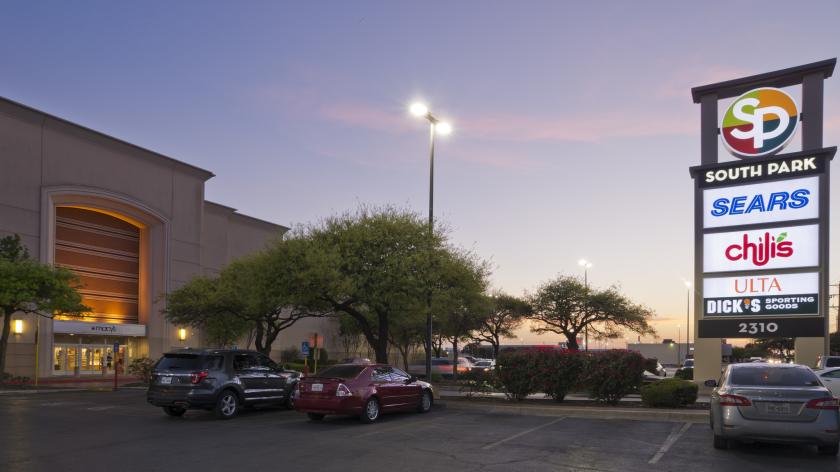
Anchored by Macy’s, JC Penney’s, and Dick’s Sporting Goods
Fitness Connection OPEN NOW; Evo Entertainment coming soon
Positioned in a heavily-trafficked area with traffic counts exceeding 137,000 VPD
$37,329 in disposable income within a 3-mile radius
Ideally situated in a highly visible and easily accessible location in South San Antonio
Recent renovation of the Center, completed in 2018, includes new floors, remodeled restrooms, new children's p
Several national retailers annually rank amongst the highest in their districts for sales trends
Over 50,000 military personnel based within 7 miles
DRONE FOOTAGE: https://youtu.be/kmGxEIHCT_M
360º PANORAMIC VIEW: https://kuula.co/post/NgkCD
South Park Mall is the premier and only regional shopping center located on the south side of San Antonio, TX. It is strategically located on a highly visible site at I-35 and SW Military Drive. The Center serves a multi-county trade area stretching throughout South Texas and Mexico and draws 11 million shoppers annually.
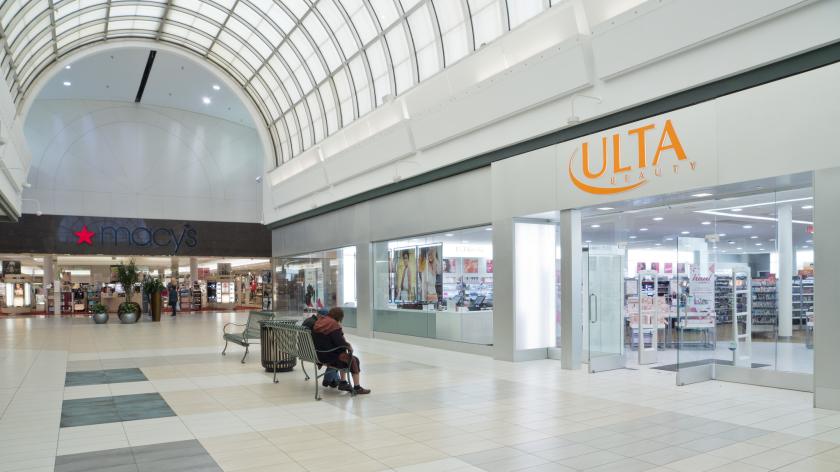
South Park Mall is anchored by Macy’s, JCPenney and Dick’s Sporting Goods and offers over 90 shops and restaurants including popular brands like Old Navy, Bath & Body Works, Victoria’s Secret, American Eagle, ULTA Beauty and James Avery.
Fitness Connection OPEN NOW; Evo Entertainment coming soon to the center.
No part of this information may be copied, reproduced, repurposed, or screen-captured for any commercial purpose without prior written authorization from MyEListing.
While we strive to provide the most accurate information, all listing information, and demographic data, is provided by third-parties. As such, MyEListing will not be responsible for the accuracy of the information. It is strongly recommended that you verify all information with the listing agent, and any relevant agencies, prior to making any decisions.
What is the building size of this commercial Retail property?
The size of this multi-unit property varies between 530 - 11239 square feet
What kind of Retail is the propery at 2310 Southwest Military Drive?
The property at 2310 Southwest Military Drive San Antonio, TX 78224 is listed as a Shopping Center Retail property
What is the population within 1 mile of 2310 Southwest Military Drive in San Antonio?
The population within 1 mile of 2310 Southwest Military Drive San Antonio, TX 78224 is 14,535 people.
Who do I contact for questions about 2310 Southwest Military Drive?
You should contact the listing agent,
Amanda Powell, for any details regarding this commercial listing.