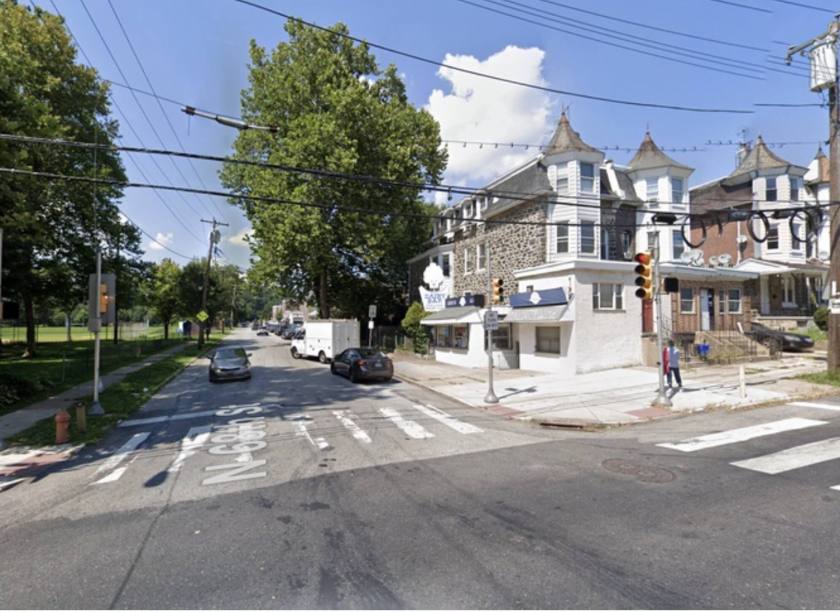
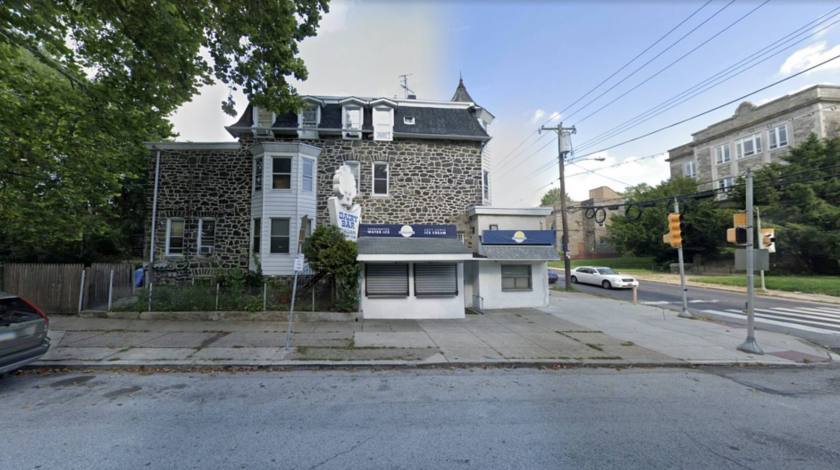
Retail Space
6727 Lansdowne Avenue Philadelphia, PA 19151
6727 Lansdowne Avenue Philadelphia, PA 19151
Details & Description
Property Highlights
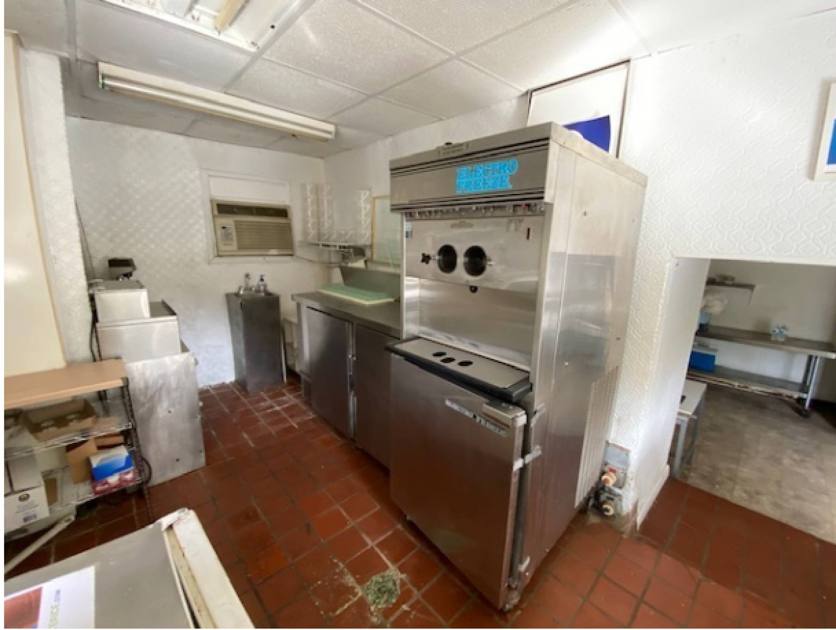
- • Italian water ice sales
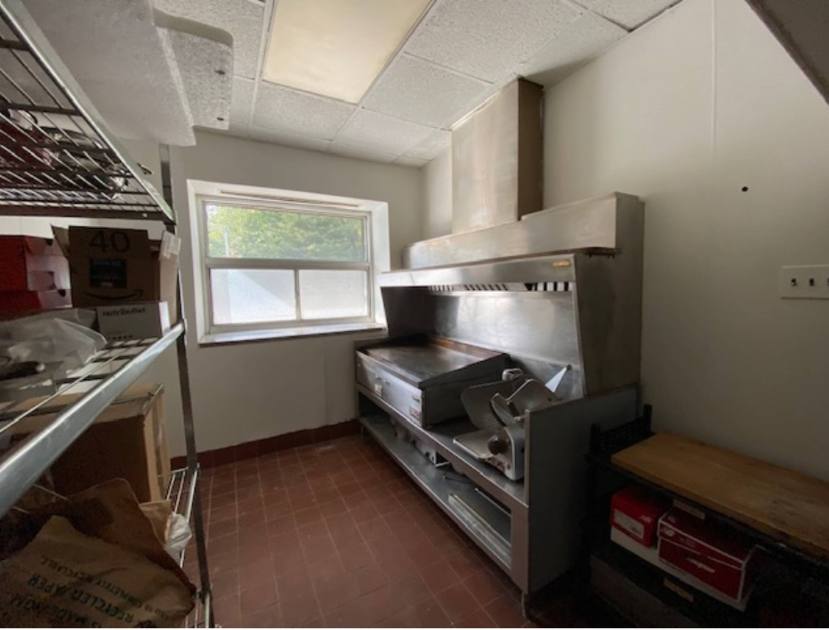
- • Cheese steak- wings- fries
- • Vent Hood
- • Signalized intersection
- • Two SEPTA routes
Additional Photos
Listing Agents

Andre Watson
O: 267-221-4946
M: 610-637-4422
andrewatson@kwcommercial.com
O: 267-221-4946
M: 610-637-4422
andrewatson@kwcommercial.com
While we strive to provide the most accurate information, all listing information, and demographic data, is provided by third-parties. As such, MyEListing will not be responsible for the accuracy of the information. It is strongly recommended that you verify all information with the listing agent, and any relevant agencies, prior to making any decisions.


