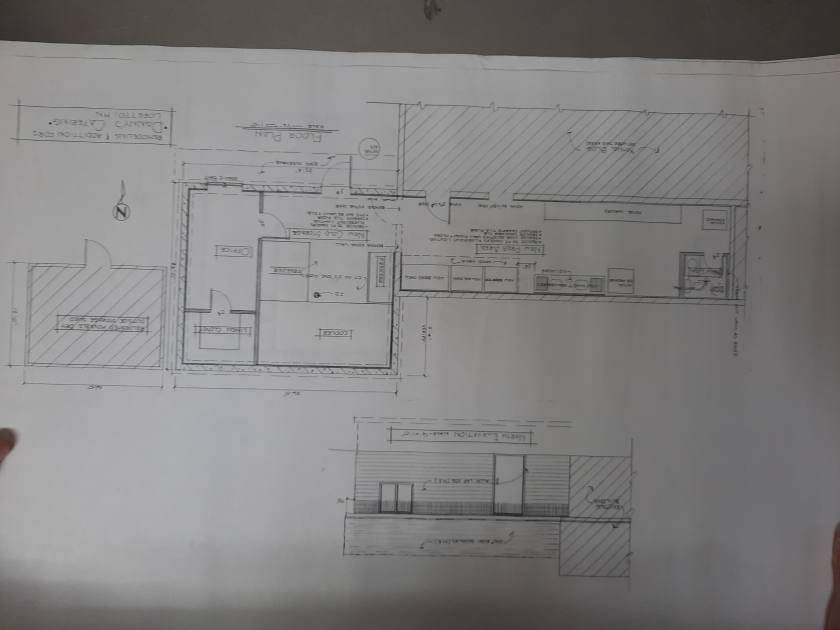
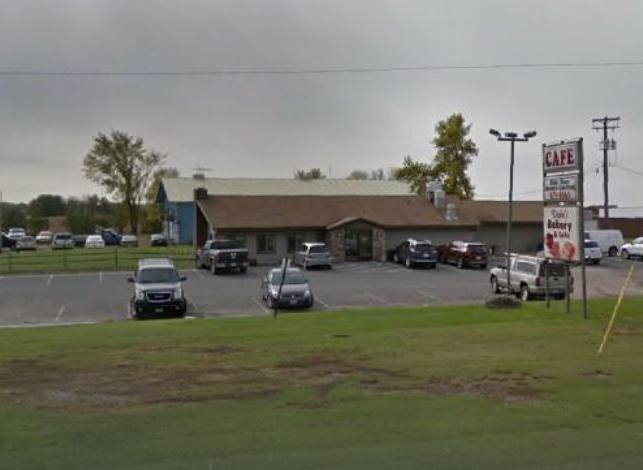
Retail Space
4425 Highway 55 Loretto, MN 55357
4425 Highway 55 Loretto, MN 55357
Details & Description
Property Highlights
• Prominent following to local clientele with close proximity to the Twin Cities and St Cloud
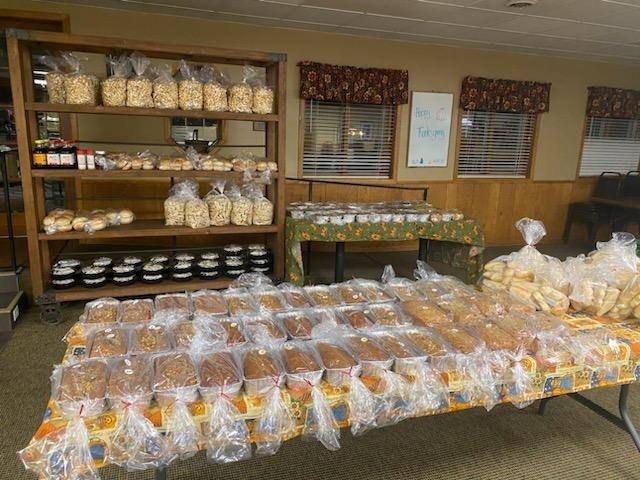
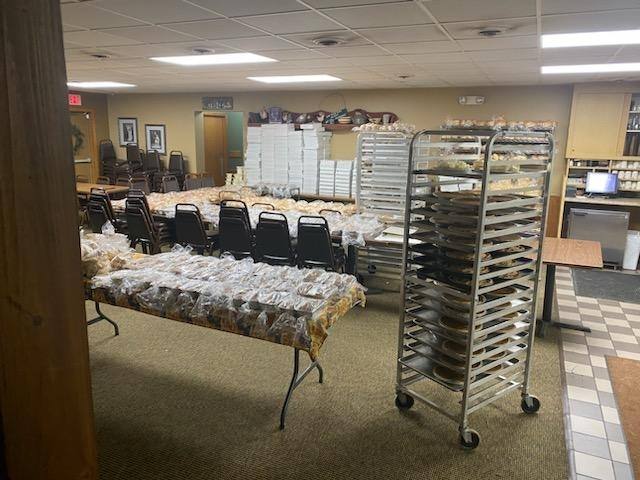
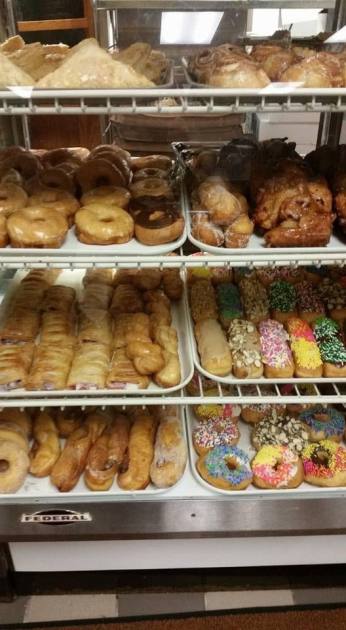
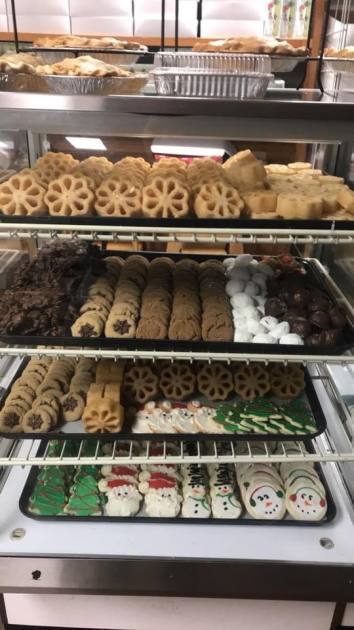
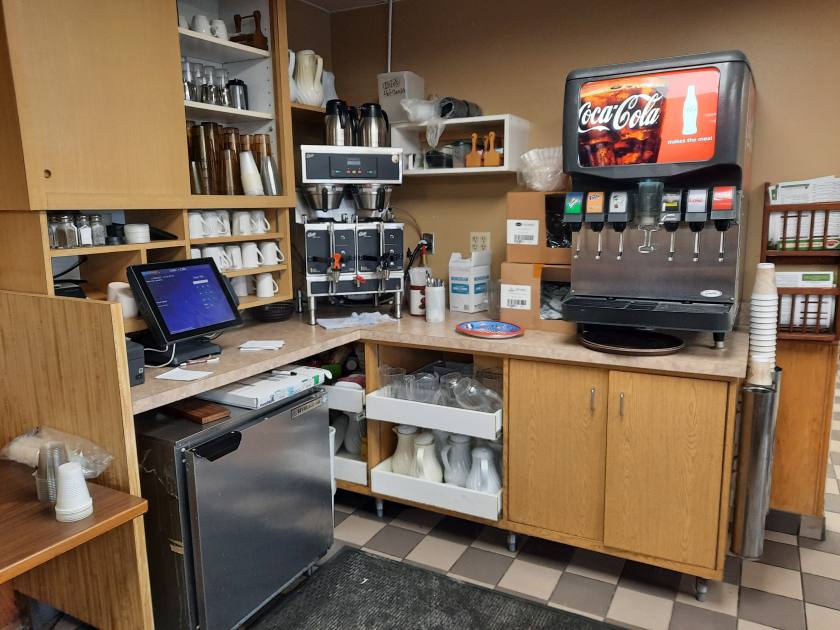
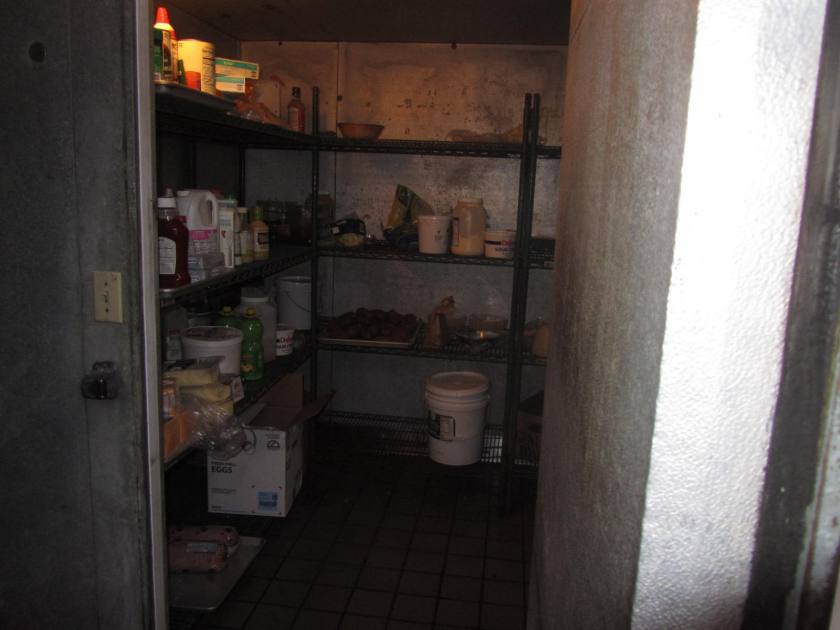
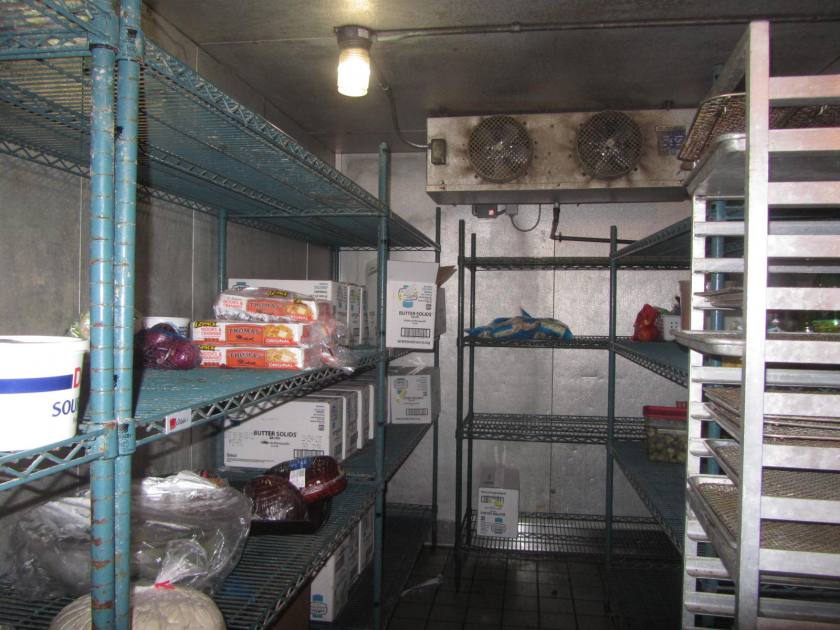
• Turn-Key Bakery in operation for new owner to also own the building with the business.
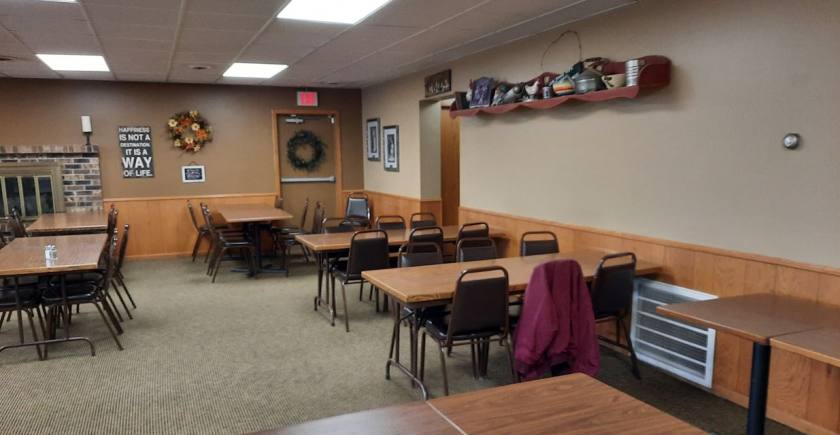
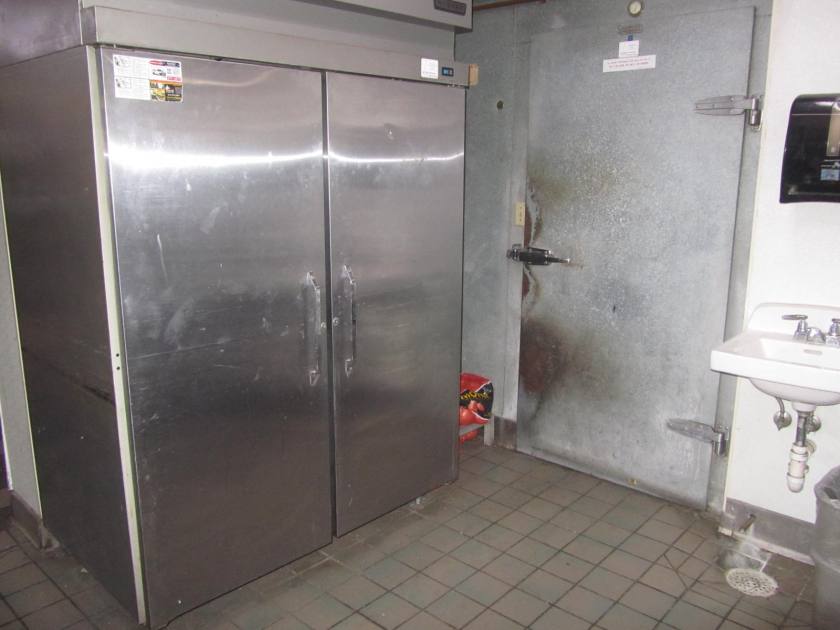
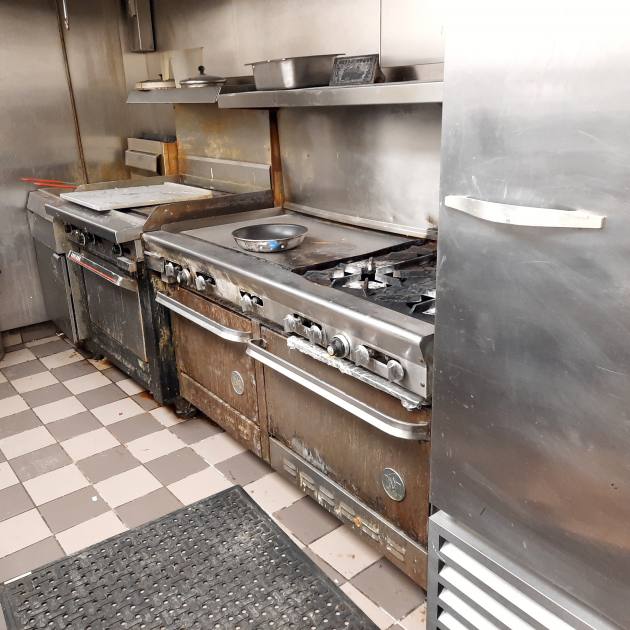
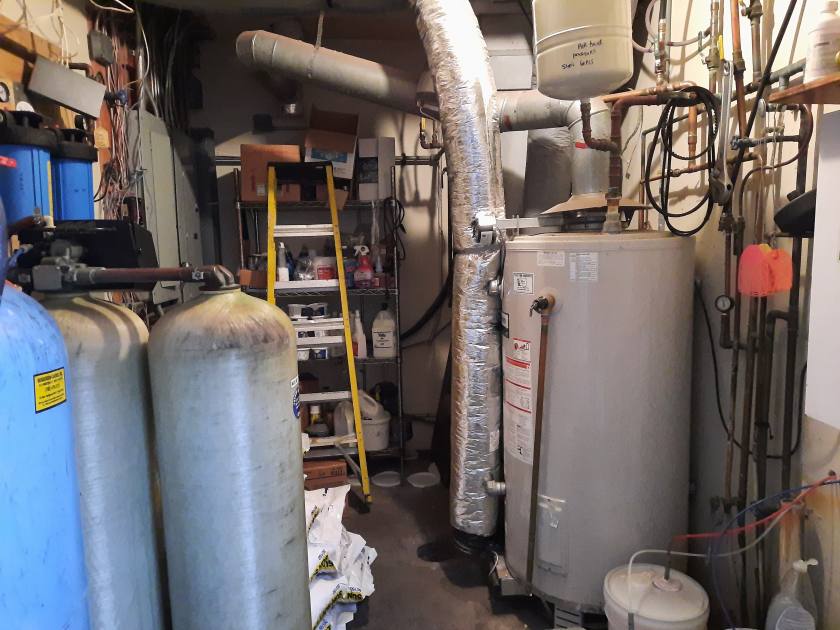
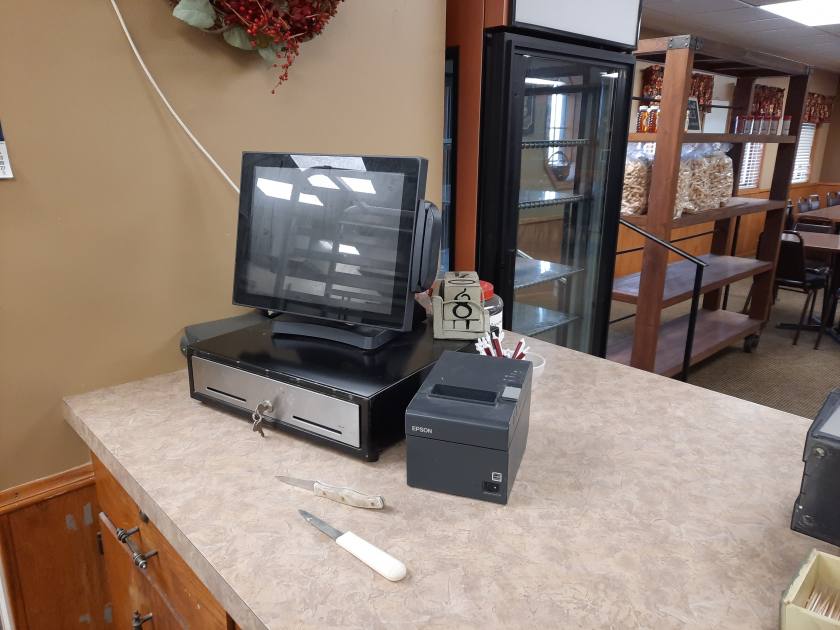
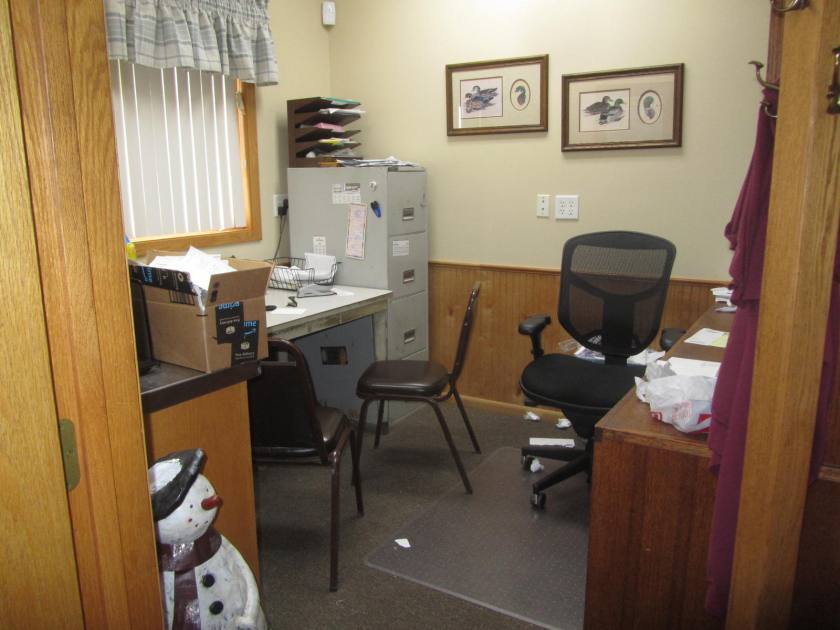
Additional Photos

Listing Agents

Robert Wolf
O: 952-881-5900
M: 612-599-4323
rjwolf@kw.com
O: 952-881-5900
M: 612-599-4323
rjwolf@kw.com
While we strive to provide the most accurate information, all listing information, and demographic data, is provided by third-parties. As such, MyEListing will not be responsible for the accuracy of the information. It is strongly recommended that you verify all information with the listing agent, and any relevant agencies, prior to making any decisions.