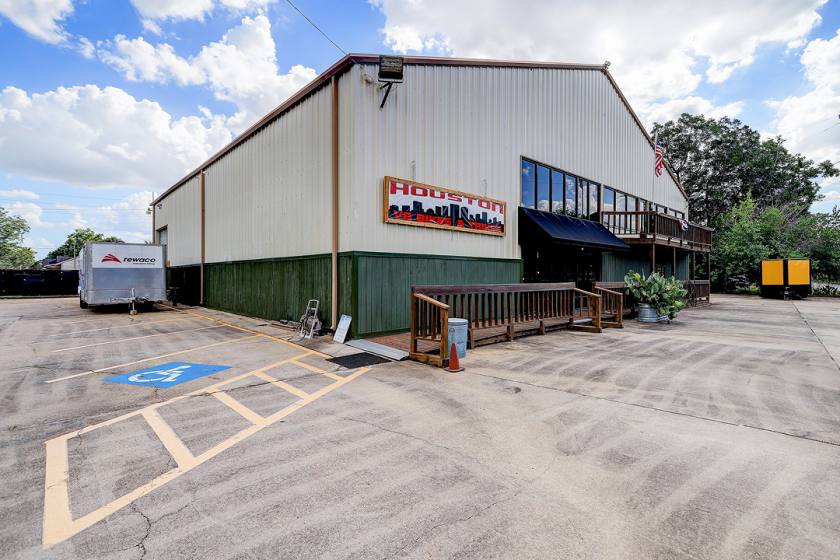
1-Mile | 3-Miles | 5-Miles | ||
---|---|---|---|---|
Total Population | 18,714 | 147,848 | 311,137 | |
Population Median Age | 31 | 35 | 35 | |
Population by Age | 0-9 Yrs | 3315 (17%) | 22108 (14%) | 45439 (14%) |
10-19 Yrs | 3214 (17%) | 23076 (15%) | 45303 (14%) | |
20-29 Yrs | 3422 (18%) | 24765 (16%) | 54458 (17%) | |
30-39 Yrs | 2233 (11%) | 19534 (13%) | 44224 (14%) | |
40-49 Yrs | 2268 (12%) | 17457 (11%) | 35994 (11%) | |
50-59 Yrs | 2116 (11%) | 16444 (11%) | 34937 (11%) | |
60-69 Yrs | 1313 (7%) | 12806 (8%) | 27318 (8%) | |
70+ Yrs | 832 (4%) | 11659 (7%) | 23463 (7%) | |
Median HH Income | $39,789 | $40,165 | $43,319 | |
Total Household Income | < 24K | 1906 (34%) | 14563 (31%) | 32225 (30%) |
25-49K | 1390 (24%) | 12906 (27%) | 27067 (25%) | |
50-74K | 981 (17%) | 8173 (17%) | 18692 (17%) | |
75-99K | 504 (9%) | 4712 (10%) | 11056 (10%) | |
100-199K | 659 (11%) | 5216 (11%) | 13753 (12%) | |
200K+ | 154 (2%) | 944 (2%) | 3463 (3%) | |
Highest Education Level | No Diploma | 4677 | 31535 | 56262 |
Diploma or GED | 3039 | 26935 | 53714 | |
Some College | 1271 | 14200 | 33461 | |
Assoc. Degree | 508 | 3825 | 9819 | |
Bachelors Degree | 644 | 7975 | 23256 | |
Higher Degree | 176 | 4609 | 15782 | |
Total Housing Units | 6,257 | 52,621 | 122,045 | |
--Owner-Occupied | 2,168 | 22,515 | 48,575 | |
--Renter-Occupied | 3,426 | 24,000 | 57,682 | |
Owner-Occupied Values | < 100K | 1155 | 10342 | 20713 |
100-199K | 830 | 8135 | 16468 | |
200-299K | 109 | 2194 | 5235 | |
300-399K | 47 | 1039 | 3488 | |
400-499K | 0 | 390 | 1324 | |
500K+ | 28 | 415 | 1348 | |
Total Working Age Population | 13,276 | 112,475 | 238,988 | |
In Work Force | 8,320 | 66,025 | 145,581 | |
Not In Work Force | 4,956 | 46,450 | 93,407 | |
Workforce Employed | 7,470 | 60,472 | 132,189 | |
Workforce Unemployed | 850 | 5,525 | 13,347 | |
Civlian Workforce | 8,320 | 65,997 | 145,536 | |
Military Workforce | 0 | 28 | 45 | |
Total Households | 5,594 | 46,515 | 106,257 | |
Family Households | 4,053 | 32,027 | 65,670 | |
Non-Family Households | 1,541 | 14,488 | 40,587 | |
Married Couple | 2,177 | 18,507 | 37,336 | |
Other Family | 1,876 | 13,520 | 28,334 | |
Married w/Child | 1,096 | 8,679 | 16,430 | |
Single Male w/Child | 336 | 1,358 | 2,655 | |
Single Female w/Child | 801 | 4,498 | 10,145 |
Population Change Last Two Decades - Plus Projection
2000 | % | 2010 | % | 2020 | % | 2030 | |
---|---|---|---|---|---|---|---|
Texas | 20,851,820 | +21 | 25,145,561 | +18 | 29,677,668 | +18 | 34,894,452 |
Harris County | 3,400,578 | +20 | 4,092,459 | +22 | 4,978,845 | +19 | 5,924,750 |
Total Working Age Population:
Total Households:
Total Working Age Population:
Total Households:
Total Working Age Population:
Total Households: