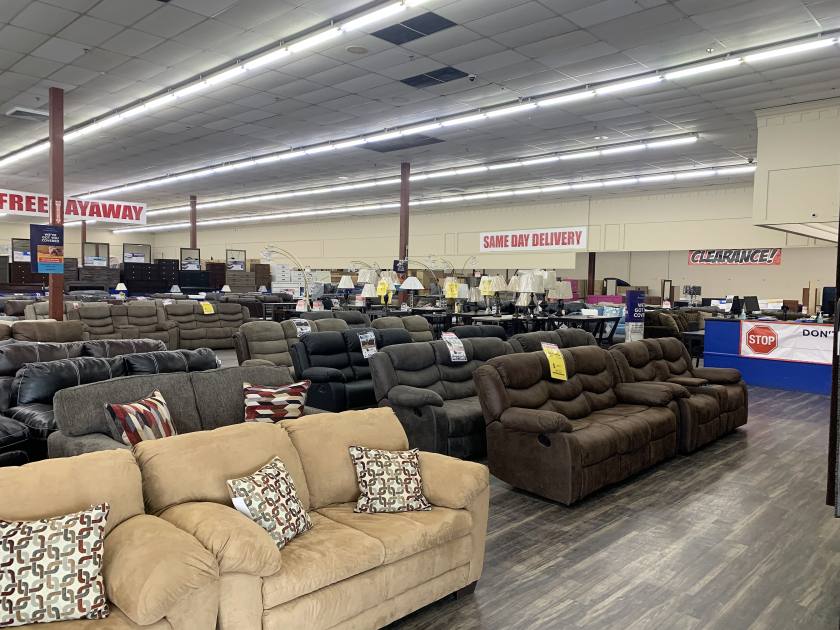
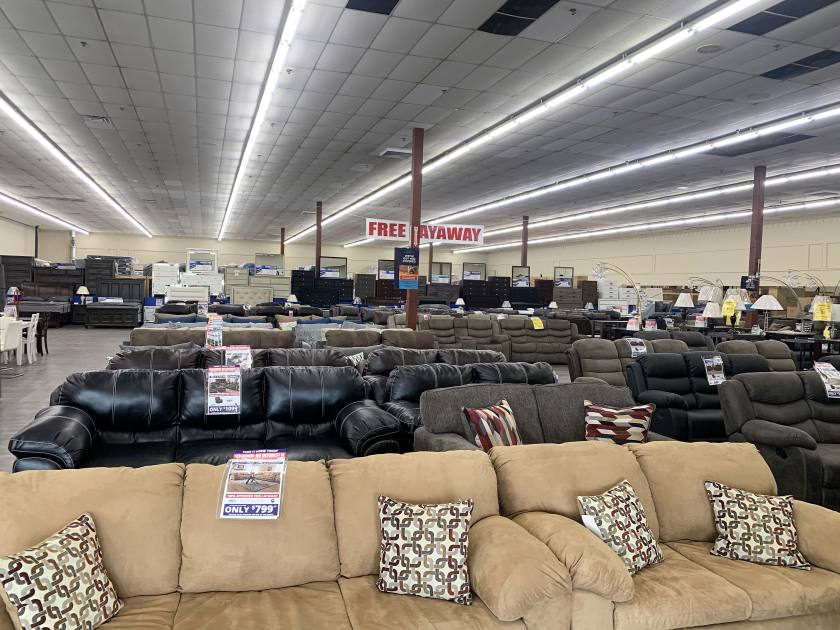
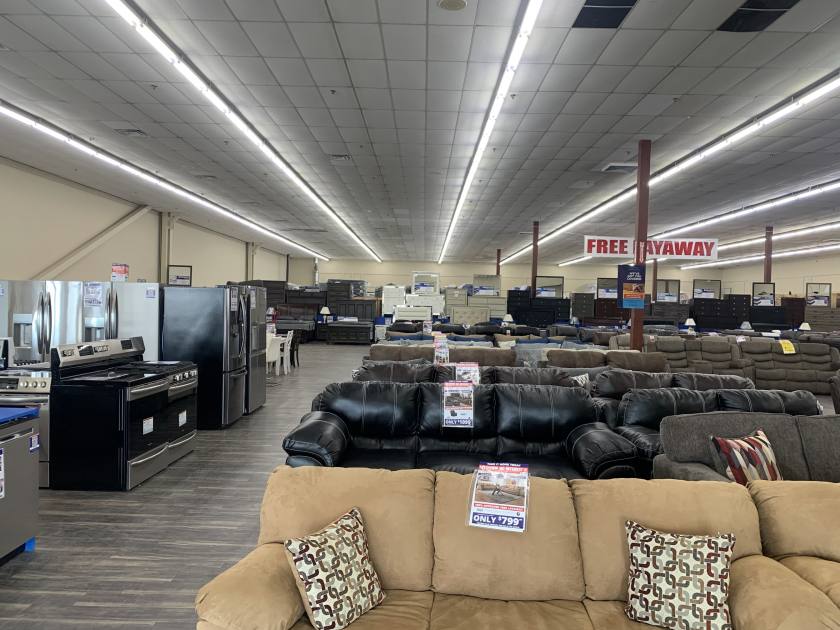
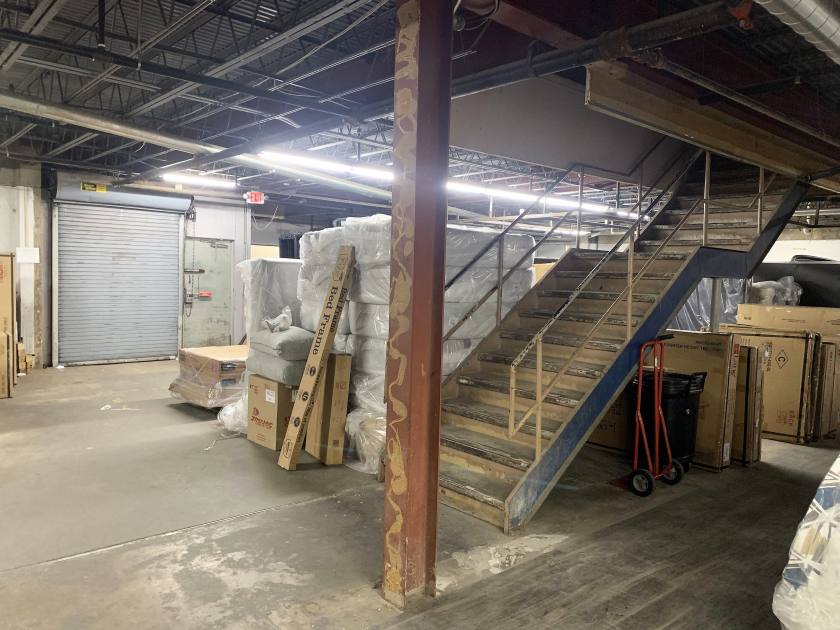
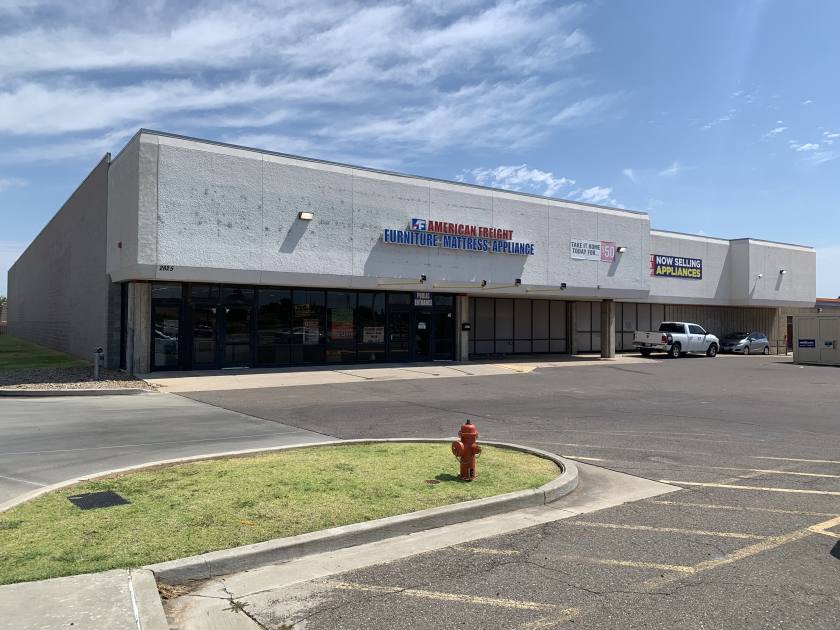
Retail Space
2825 West Interstate 240 Service Road Oklahoma City, OK 73159
2825 West Interstate 240 Service Road Oklahoma City, OK 73159
Details & Description
Property Highlights
- • Single tenant, long term lease
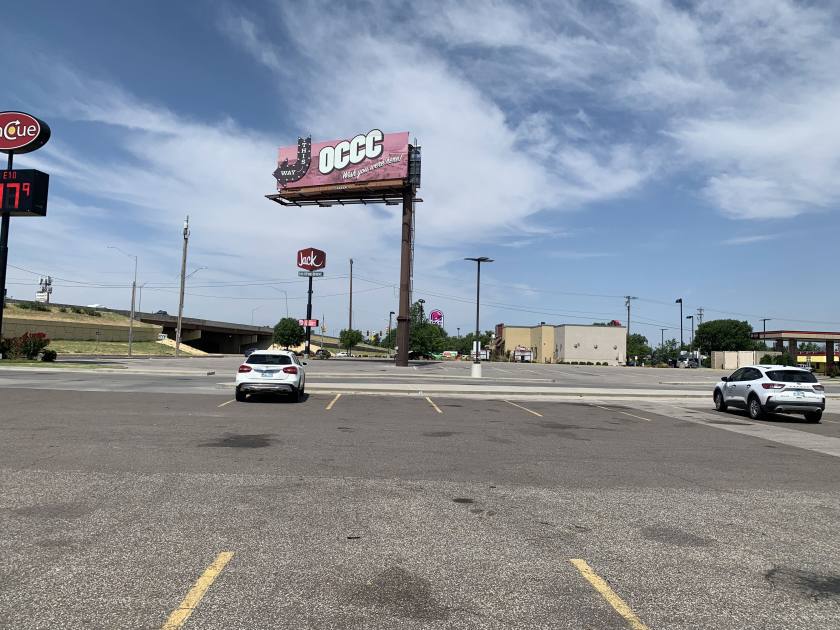
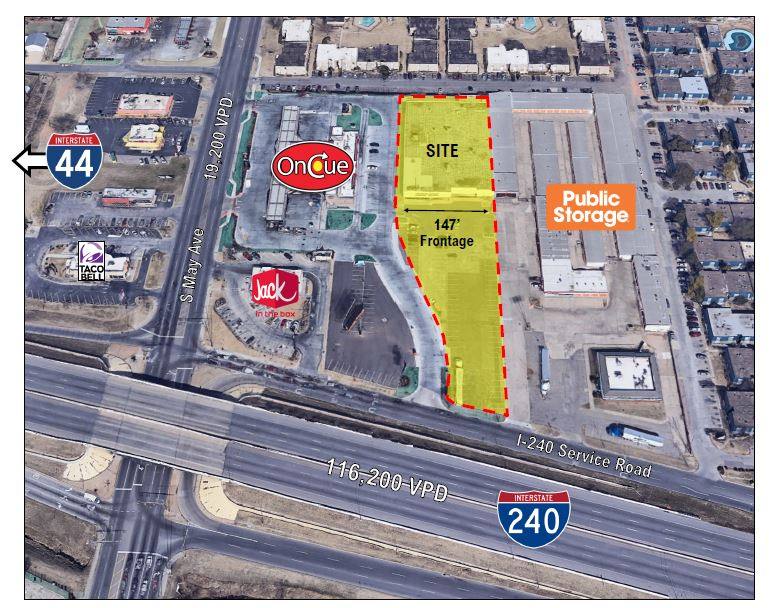
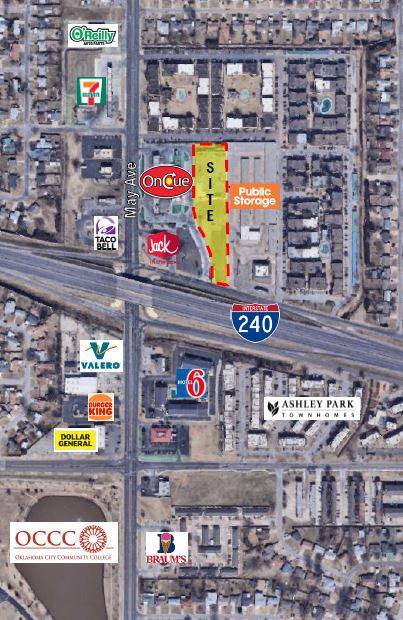
- • 116,200 +/- vehicles per day on I-240
- • 19,200 +/- vehicles per day on S May Ave
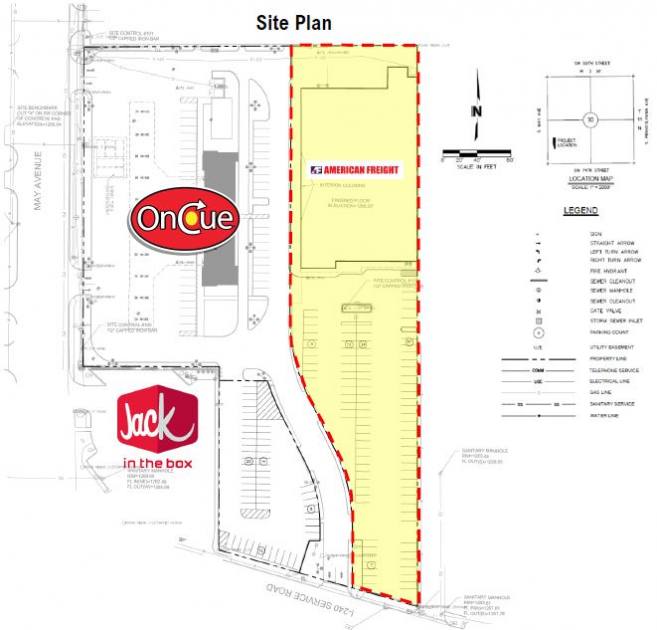
- • Cross access agreement with OnCue
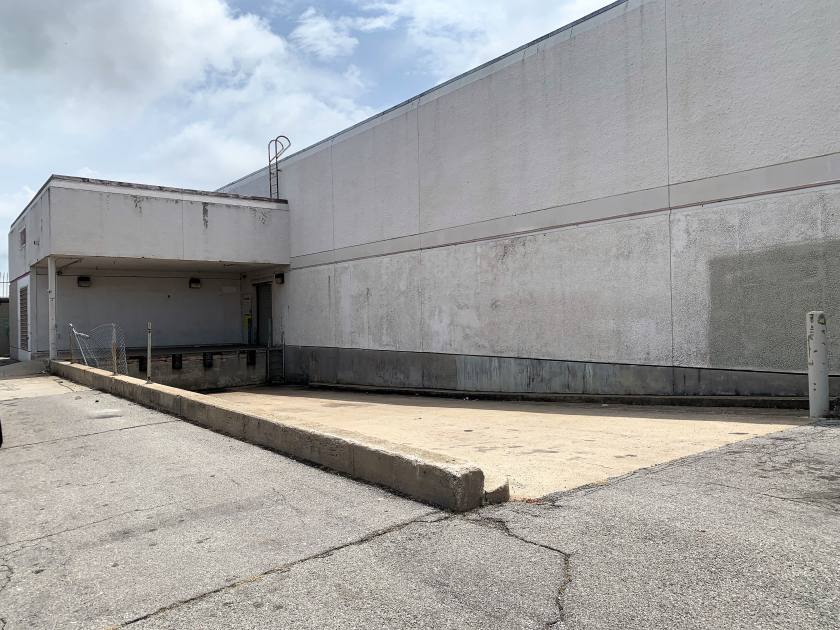
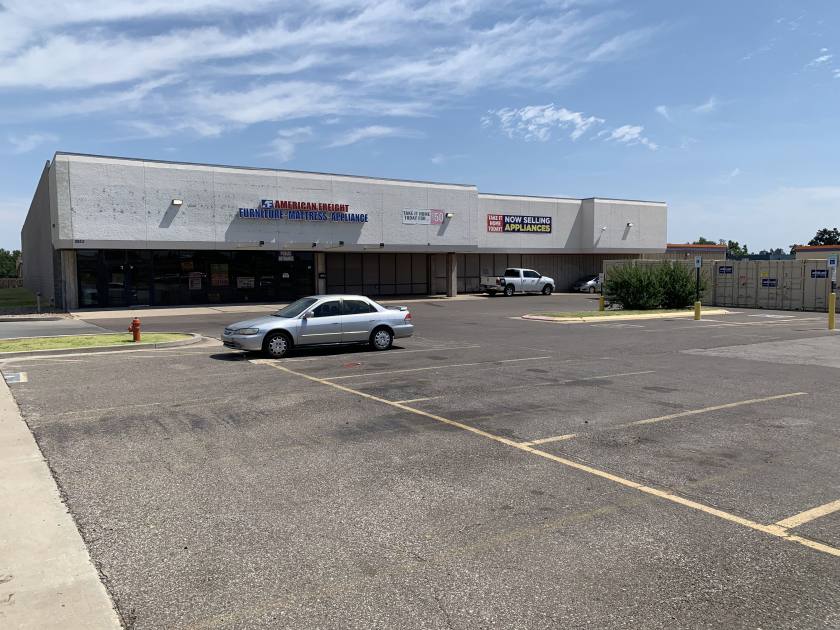
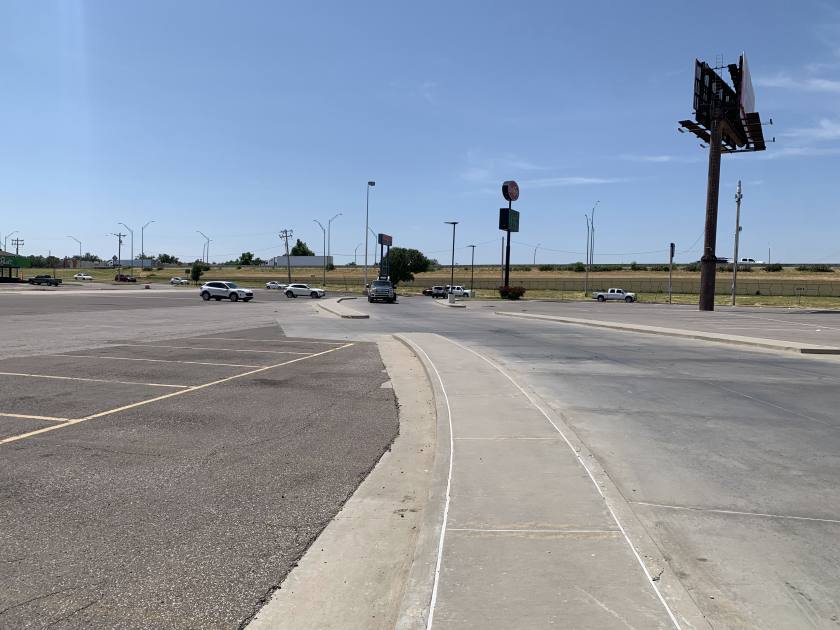
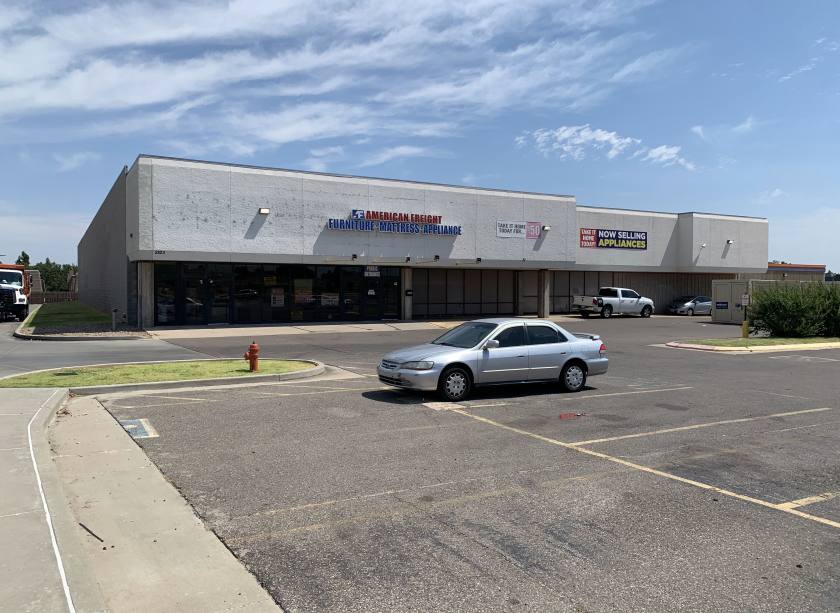
Additional Photos

Listing Agents

Sarah Ingle
O: 405-231-5700
M: 918-801-8136
single@lrcre.com
O: 405-231-5700
M: 918-801-8136
single@lrcre.com
While we strive to provide the most accurate information, all listing information, and demographic data, is provided by third-parties. As such, MyEListing will not be responsible for the accuracy of the information. It is strongly recommended that you verify all information with the listing agent, and any relevant agencies, prior to making any decisions.