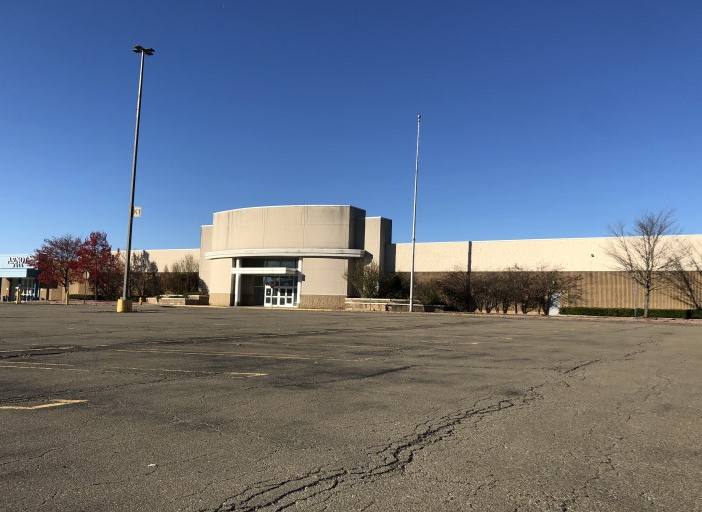
Retail Space
3300 Chambers Road Horseheads, NY 14845
3300 Chambers Road Horseheads, NY 14845
Details & Description
Property Highlights
- • In bustling regional retail area
- • Adjacent with easy access from Route 86
- • Close to Corning, Elmira and Horseheads
- • Building for sale subject to a long term landlease
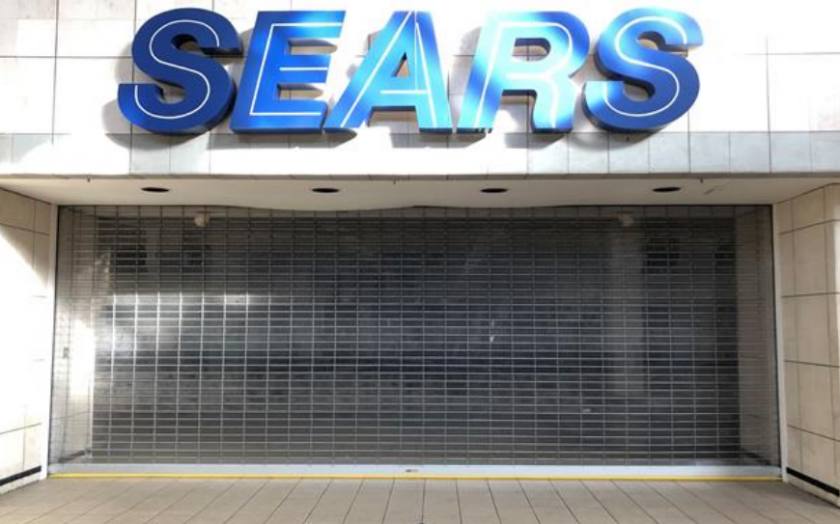
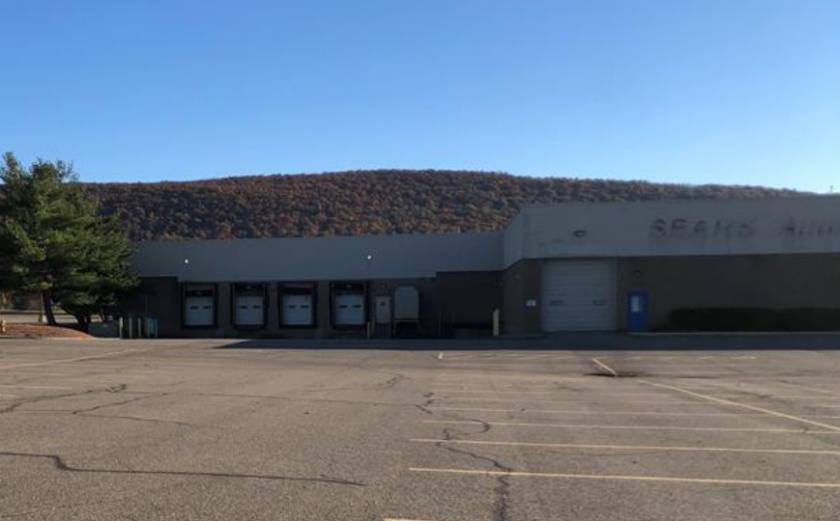
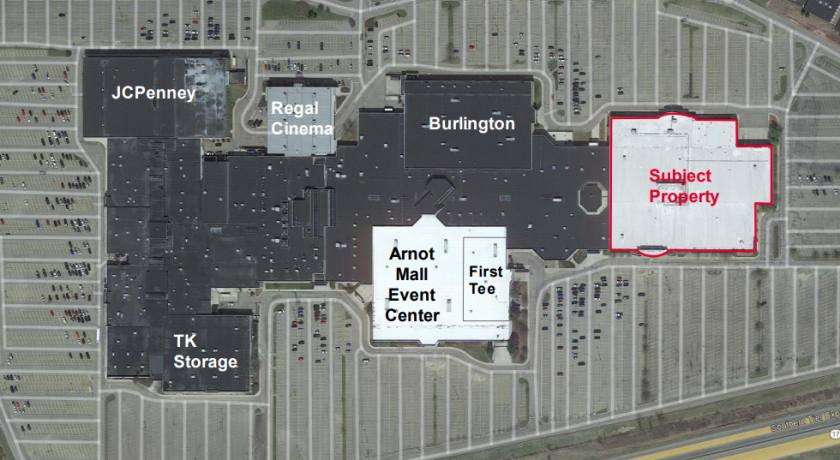
Additional Photos

Listing Agents

Lila M. Salvetti
O: 315-445-8524
M: 315-254-3447
lsalvetti@pyramidbrokerage.com
O: 315-445-8524
M: 315-254-3447
lsalvetti@pyramidbrokerage.com
While we strive to provide the most accurate information, all listing information, and demographic data, is provided by third-parties. As such, MyEListing will not be responsible for the accuracy of the information. It is strongly recommended that you verify all information with the listing agent, and any relevant agencies, prior to making any decisions.


