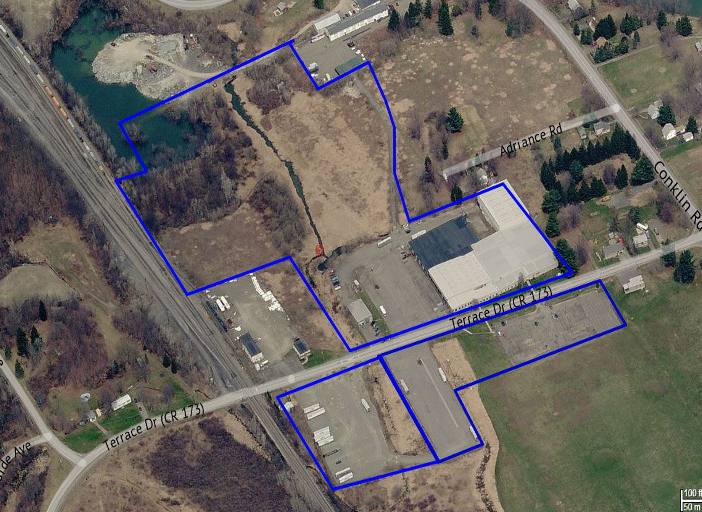
Industrial Properties
24 Terrace Drive Conklin, NY 13748
24 Terrace Drive Conklin, NY 13748
Details & Description
Property Highlights
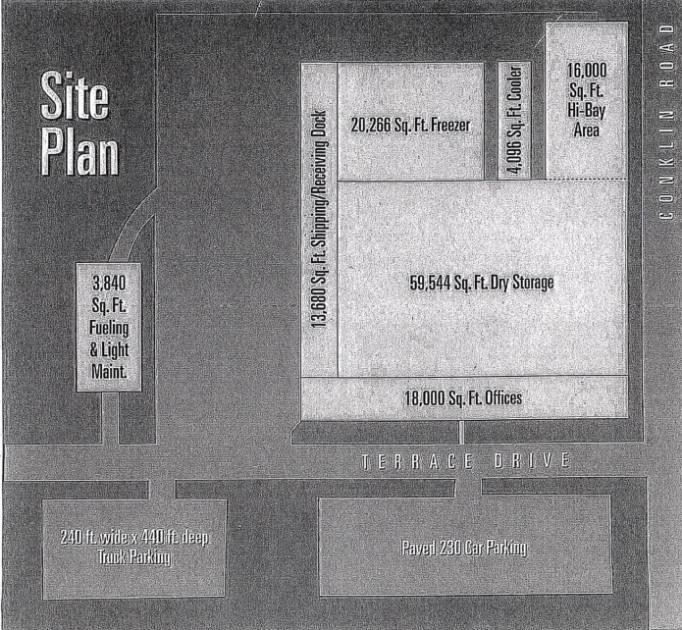
- • 17 dock doors 9’x8’
- • 22’ clear in center ceiling height
- • 16,000 SF high-bay area, 32’ clear
- • City water and sewer
- • 3,500 AMP electric service, 3-phase available
- • Gas radiant heat in warehouse
Listing Agents

Leo F. Jones
O: 607-754-5990
M: 607-427-5998
ljones@pyramidbrokerage.com
O: 607-754-5990
M: 607-427-5998
ljones@pyramidbrokerage.com

Bruce Ethan Cook
O: 607-754-5990
M: 607-725-9118
ecook@pyramidbrokerage.com
O: 607-754-5990
M: 607-725-9118
ecook@pyramidbrokerage.com
While we strive to provide the most accurate information, all listing information, and demographic data, is provided by third-parties. As such, MyEListing will not be responsible for the accuracy of the information. It is strongly recommended that you verify all information with the listing agent, and any relevant agencies, prior to making any decisions.