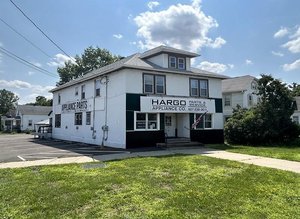
1-Mile | 3-Miles | 5-Miles | ||
---|---|---|---|---|
Total Population | 833 | 14,429 | 52,280 | |
Population Median Age | 45 | 42 | 40 | |
Population by Age | 0-9 Yrs | 128 (15%) | 1541 (10%) | 5557 (10%) |
10-19 Yrs | 52 (6%) | 1595 (11%) | 5679 (10%) | |
20-29 Yrs | 31 (3%) | 1976 (13%) | 10170 (19%) | |
30-39 Yrs | 116 (13%) | 1501 (10%) | 5893 (11%) | |
40-49 Yrs | 113 (13%) | 1887 (13%) | 5668 (10%) | |
50-59 Yrs | 111 (13%) | 1981 (13%) | 6886 (13%) | |
60-69 Yrs | 152 (18%) | 2176 (15%) | 6427 (12%) | |
70+ Yrs | 131 (15%) | 1772 (12%) | 6001 (11%) | |
Median HH Income | $52,776 | $51,883 | $44,447 | |
Total Household Income | < 24K | 75 (19%) | 1257 (20%) | 6975 (31%) |
25-49K | 100 (25%) | 1666 (27%) | 5259 (23%) | |
50-74K | 91 (23%) | 1320 (21%) | 3903 (17%) | |
75-99K | 65 (16%) | 745 (12%) | 2538 (11%) | |
100-199K | 50 (12%) | 936 (15%) | 3088 (13%) | |
200K+ | 5 (1%) | 129 (2%) | 680 (3%) | |
Highest Education Level | No Diploma | 93 | 1271 | 4549 |
Diploma or GED | 242 | 3528 | 10699 | |
Some College | 124 | 2078 | 6748 | |
Assoc. Degree | 76 | 1286 | 3894 | |
Bachelors Degree | 74 | 1208 | 4800 | |
Higher Degree | 36 | 662 | 3794 | |
Total Housing Units | 417 | 6,477 | 25,841 | |
--Owner-Occupied | 250 | 3,901 | 11,570 | |
--Renter-Occupied | 135 | 2,151 | 10,873 | |
Owner-Occupied Values | < 100K | 148 | 2135 | 5764 |
100-199K | 89 | 1391 | 4070 | |
200-299K | 9 | 221 | 1134 | |
300-399K | 3 | 52 | 196 | |
400-499K | 0 | 20 | 117 | |
500K+ | 2 | 83 | 290 | |
Total Working Age Population | 655 | 11,927 | 43,460 | |
In Work Force | 368 | 6,818 | 24,733 | |
Not In Work Force | 288 | 5,109 | 18,727 | |
Workforce Employed | 310 | 6,100 | 22,246 | |
Workforce Unemployed | 58 | 709 | 2,474 | |
Civlian Workforce | 368 | 6,809 | 24,719 | |
Military Workforce | 0 | 9 | 14 | |
Total Households | 386 | 6,052 | 22,443 | |
Family Households | 182 | 3,634 | 11,701 | |
Non-Family Households | 204 | 2,418 | 10,742 | |
Married Couple | 114 | 2,311 | 7,471 | |
Other Family | 68 | 1,323 | 4,230 | |
Married w/Child | 26 | 710 | 2,626 | |
Single Male w/Child | 17 | 150 | 462 | |
Single Female w/Child | 28 | 622 | 2,104 |
Population Change Last Two Decades - Plus Projection
2000 | % | 2010 | % | 2020 | % | 2030 | |
---|---|---|---|---|---|---|---|
New York | 18,976,457 | +2 | 19,378,102 | +4 | 20,146,131 | +2 | 20,604,030 |
Broome County | 200,536 | 0 | 200,600 | -4 | 192,262 | -3 | 186,950 |
Total Working Age Population:
Total Households:
Total Working Age Population:
Total Households:
Total Working Age Population:
Total Households: