Industrial Properties
535 Persimmon St Tomball, TX 77375
535 Persimmon St Tomball, TX 77375

Details & Description
Property Highlights
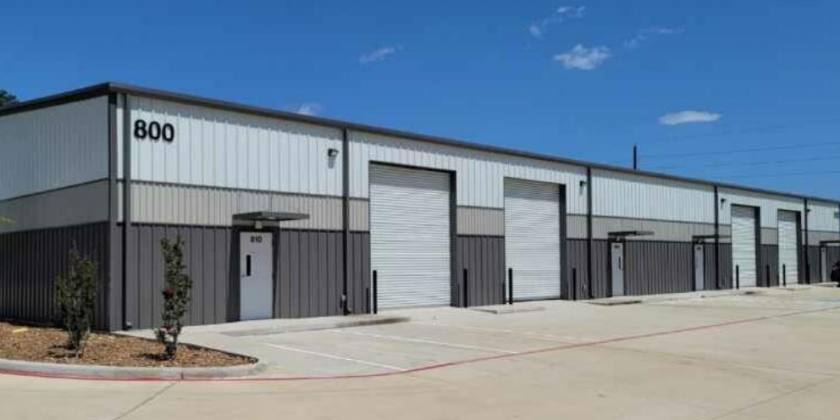
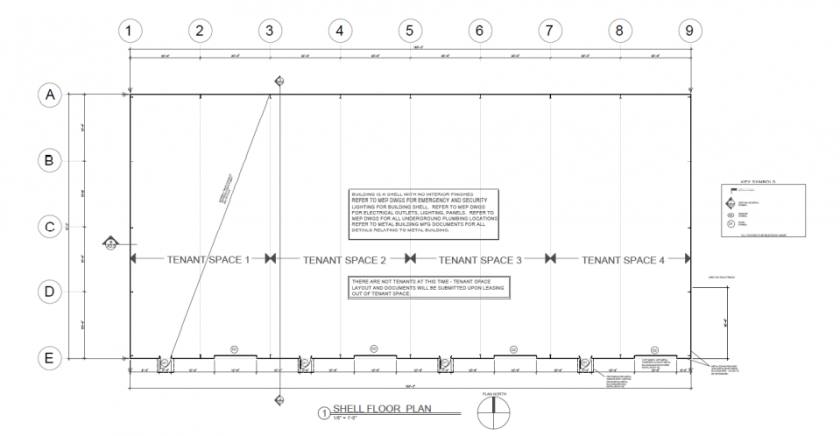
- • 12,000 SF – Divisible by 3,000 SF
- • Estimated Delivery: Q3 2022
- • Tenant Improvements Negotiable
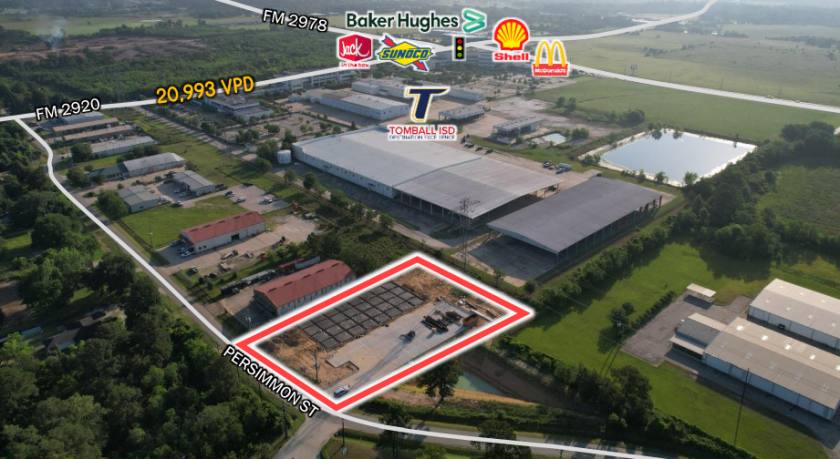
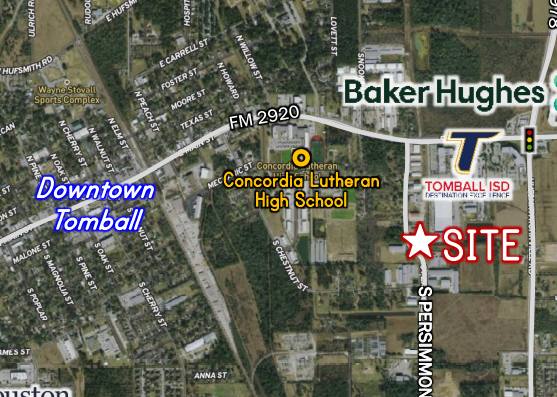
- • Easy Access – SH 249, FM 2920
- • Utilities: City of Tomball
Additional Photos
Listing Agents

Nick Childs
O: 281-210-3090
M: 281-210-2487
nick@newcorcre.com
O: 281-210-3090
M: 281-210-2487
nick@newcorcre.com

Josh Cheatham
Newcor CRE
O: 281-210-3090
M: 281-210-0097
josh@newcorcre.com
Newcor CRE
O: 281-210-3090
M: 281-210-0097
josh@newcorcre.com
While we strive to provide the most accurate information, all listing information, and demographic data, is provided by third-parties. As such, MyEListing will not be responsible for the accuracy of the information. It is strongly recommended that you verify all information with the listing agent, and any relevant agencies, prior to making any decisions.


