Industrial Properties
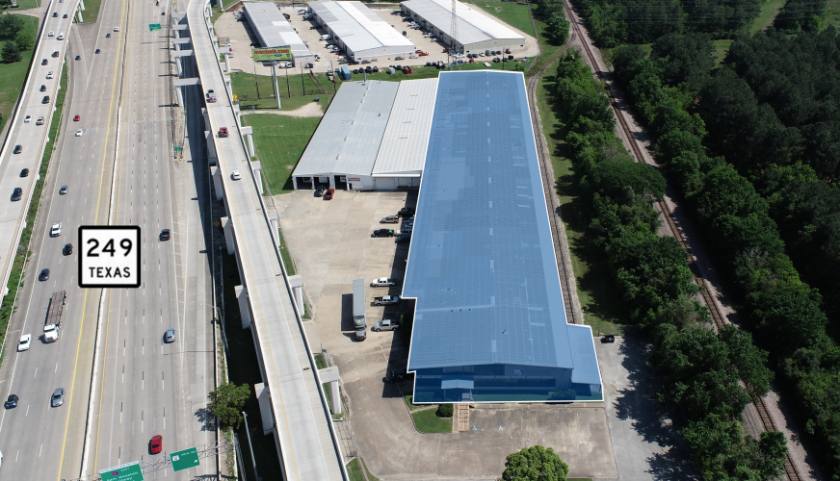
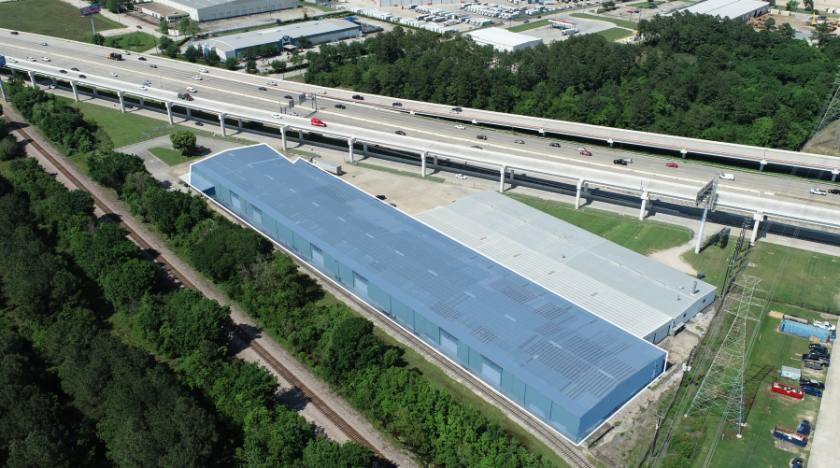
16001 Texas 249 Houston, TX 77086
16001 Texas 249 Houston, TX 77086
Details & Description
Property Highlights
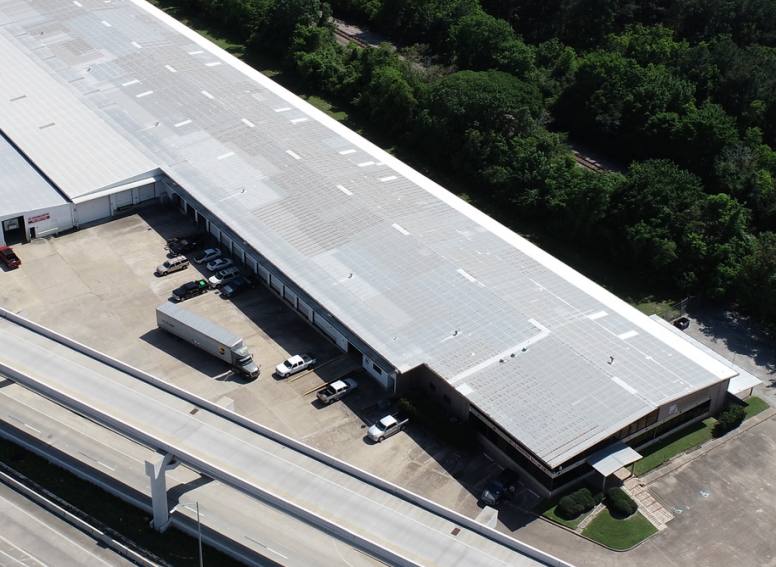
- • Office & Showroom SF: +/-9,000SF
- • Eleven (11) Dock High Doors
- • One (1) Oversize Dock High Door
- • One (1) Grade Level Ramp
- • 18' Clear Height
- • Fluorescent Warehouse Lighting
Listing Agents

Jim Autenreith
O: 713-773-5500
M: 713-773-5593
jautenreith@moodyrambinint.com
O: 713-773-5500
M: 713-773-5593
jautenreith@moodyrambinint.com

Sam Rayburn
O: 713-373-0441
srayburn@moodyrambinint.com
O: 713-373-0441
srayburn@moodyrambinint.com
While we strive to provide the most accurate information, all listing information, and demographic data, is provided by third-parties. As such, MyEListing will not be responsible for the accuracy of the information. It is strongly recommended that you verify all information with the listing agent, and any relevant agencies, prior to making any decisions.