Industrial Properties
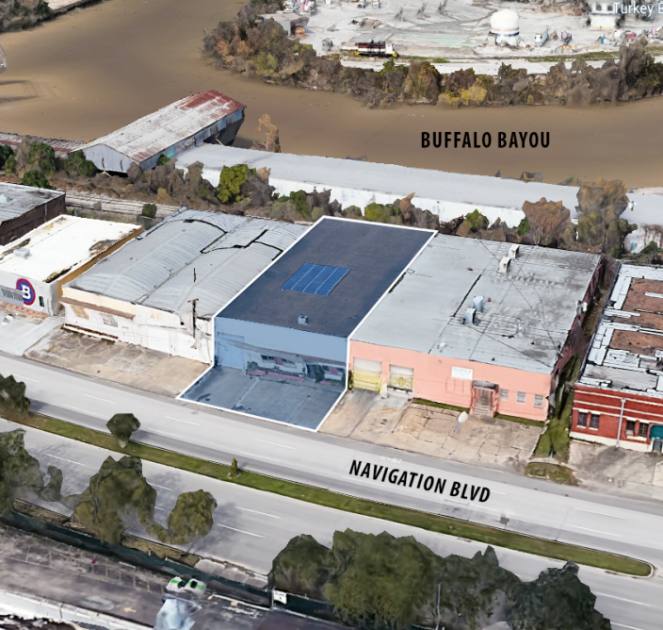
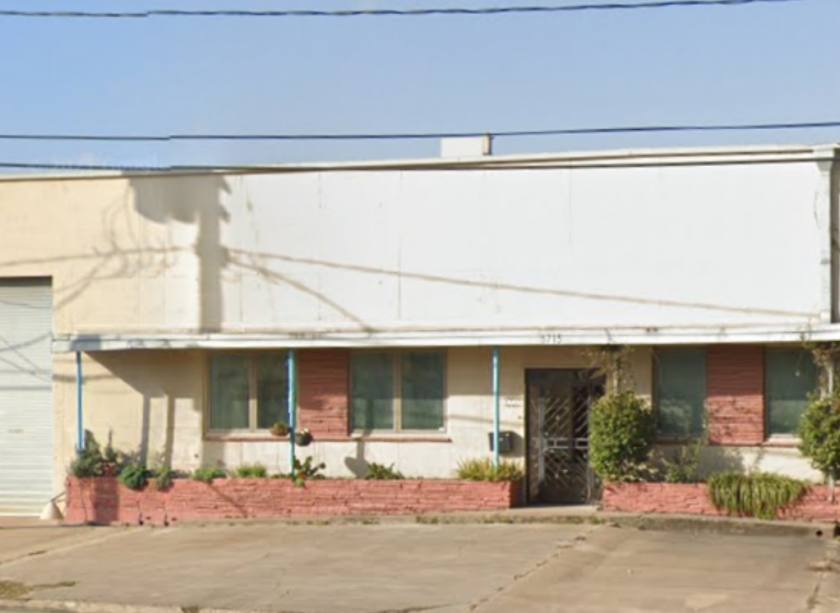
5715 Navigation Boulevard Houston, TX 77011
5715 Navigation Boulevard Houston, TX 77011
Details & Description
Property Highlights
- • New Warehouse and Office Lighting
- • Solar Energy Panels
- • Drive-in: 1
- • New Roof Installed in 2021
- • Located Near the “East End Maker Hub”
- • Residential quality finishes to the office
Listing Agents

Davis Sheffield
O: 713-773-5500
M: 713-373-0423
dsheffield@moodyrambinint.com
O: 713-773-5500
M: 713-373-0423
dsheffield@moodyrambinint.com

Thomas Erwin
O: 713-773-5571
M: 713-516-0052
terwin@moodyrambinint.com
O: 713-773-5571
M: 713-516-0052
terwin@moodyrambinint.com
While we strive to provide the most accurate information, all listing information, and demographic data, is provided by third-parties. As such, MyEListing will not be responsible for the accuracy of the information. It is strongly recommended that you verify all information with the listing agent, and any relevant agencies, prior to making any decisions.