Office Space
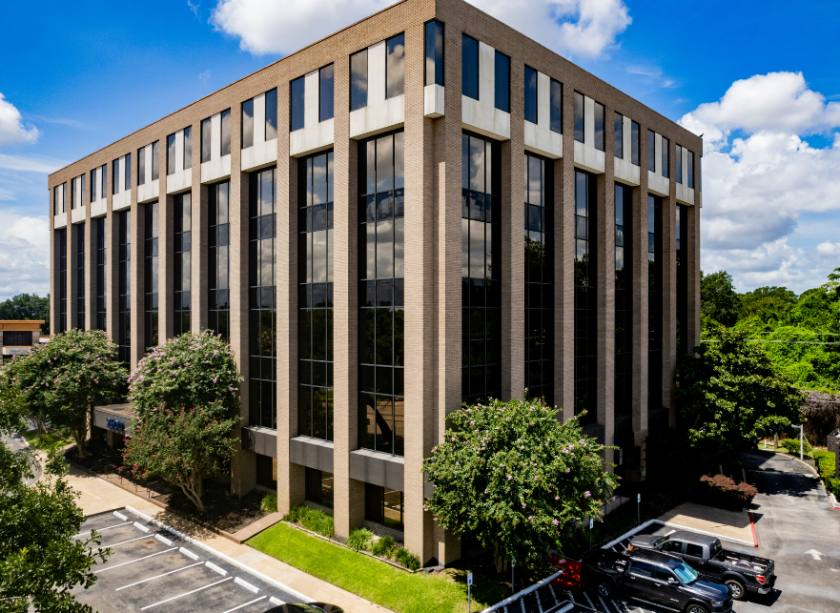
2600 South Gessner Road Houston, TX 77063
2600 South Gessner Road Houston, TX 77063
Details & Description
Property Highlights
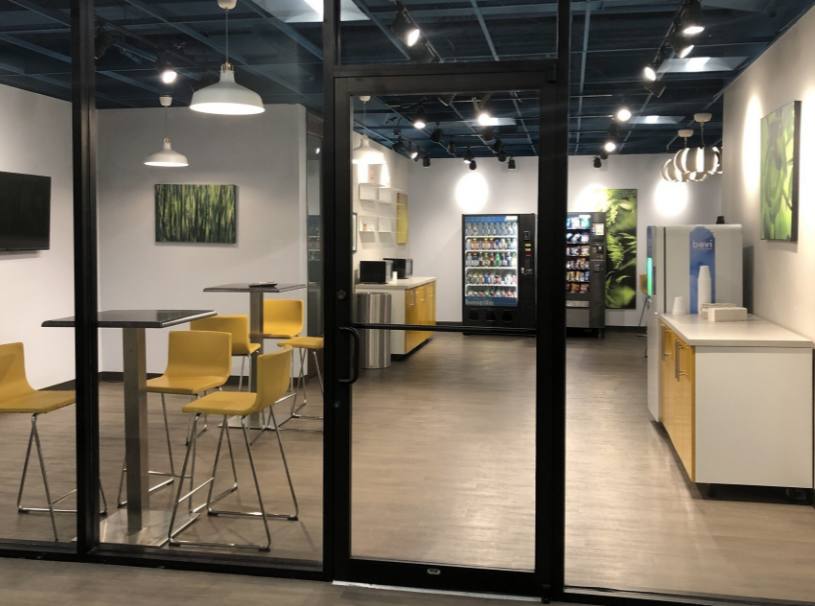
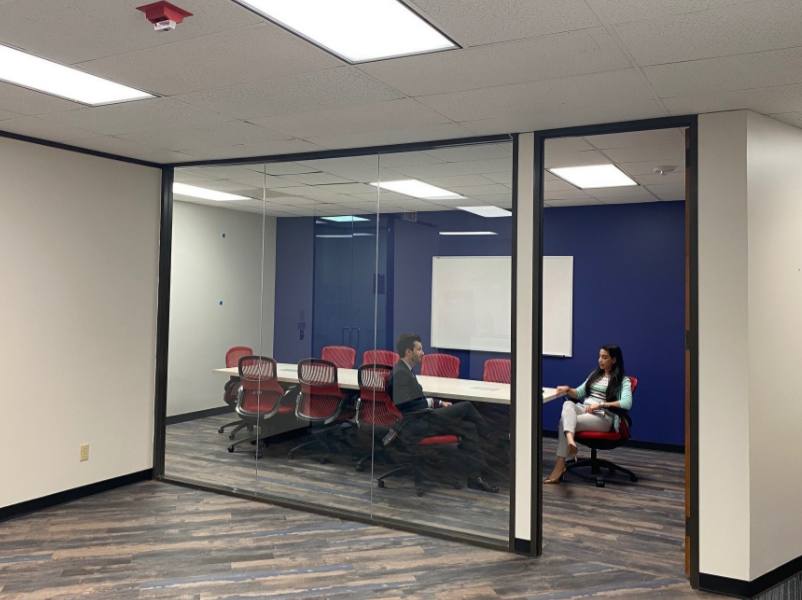
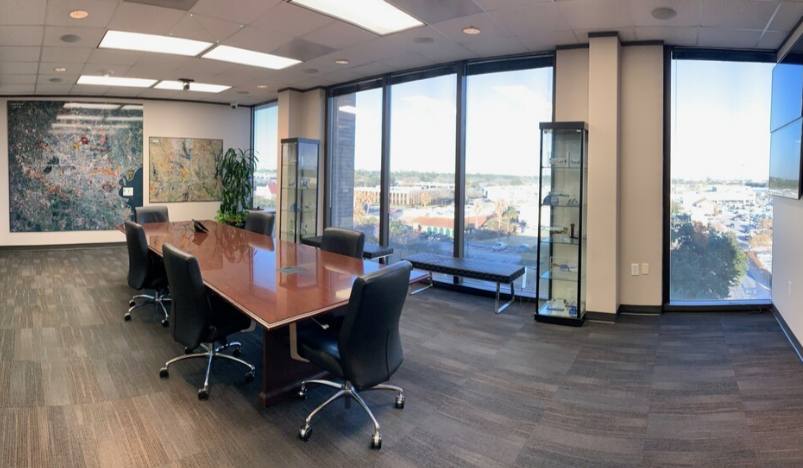
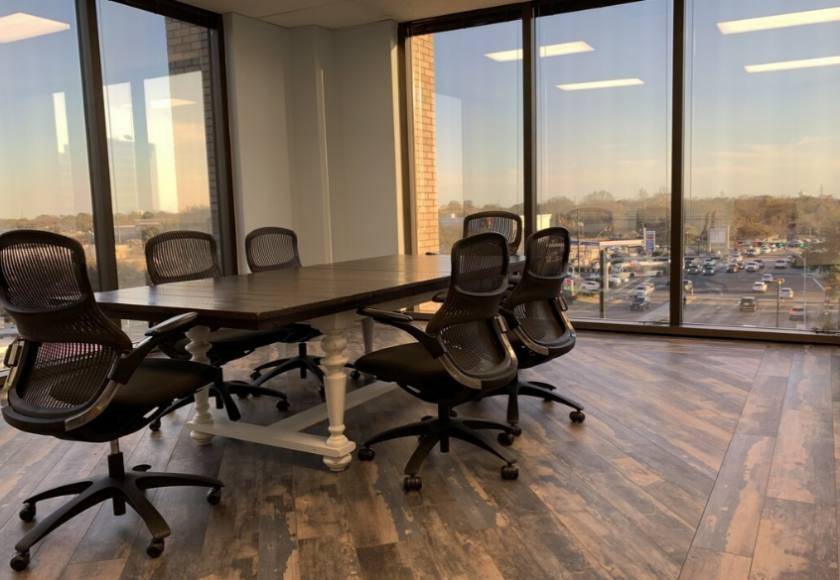
- • Move-in ready space available
- • Spaces suitable for small to large businesses
- • Total Building SF 106,169 SF
- • Parking Ratio 3.0/1000
- • Floors 6
- • Operating Expenses $9.35
Additional Photos

Listing Agents

Kurt Kistler
O: 713-773-5590
kkistler@moodyrambinint.com
O: 713-773-5590
kkistler@moodyrambinint.com

Joel Dalak
O: 713-773-5500
M: 713-773-5596
jdalak@moodyrambinint.com
O: 713-773-5500
M: 713-773-5596
jdalak@moodyrambinint.com
While we strive to provide the most accurate information, all listing information, and demographic data, is provided by third-parties. As such, MyEListing will not be responsible for the accuracy of the information. It is strongly recommended that you verify all information with the listing agent, and any relevant agencies, prior to making any decisions.