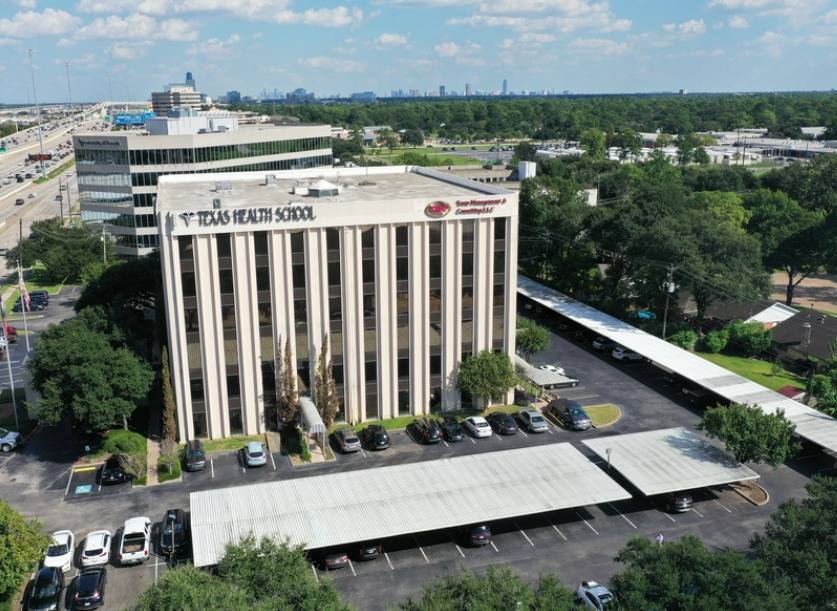
1-Mile | 3-Miles | 5-Miles | ||
---|---|---|---|---|
Total Population | 13,207 | 110,189 | 302,968 | |
Population Median Age | 36 | 36 | 36 | |
Population by Age | 0-9 Yrs | 2069 (15%) | 16089 (14%) | 41201 (13%) |
10-19 Yrs | 1847 (13%) | 14216 (12%) | 35645 (11%) | |
20-29 Yrs | 1325 (10%) | 15017 (13%) | 48585 (16%) | |
30-39 Yrs | 1746 (13%) | 17778 (16%) | 51143 (16%) | |
40-49 Yrs | 2338 (17%) | 15462 (14%) | 39805 (13%) | |
50-59 Yrs | 1571 (11%) | 12504 (11%) | 34366 (11%) | |
60-69 Yrs | 1370 (10%) | 10035 (9%) | 27508 (9%) | |
70+ Yrs | 942 (7%) | 9088 (8%) | 24714 (8%) | |
Median HH Income | $78,344 | $73,588 | $62,867 | |
Total Household Income | < 24K | 444 (9%) | 6289 (14%) | 22080 (17%) |
25-49K | 974 (20%) | 8694 (19%) | 29215 (23%) | |
50-74K | 933 (19%) | 7833 (17%) | 21527 (17%) | |
75-99K | 545 (11%) | 5089 (11%) | 13641 (10%) | |
100-199K | 882 (18%) | 9475 (21%) | 23309 (18%) | |
200K+ | 1070 (22%) | 7311 (16%) | 15820 (12%) | |
Highest Education Level | No Diploma | 930 | 5508 | 22019 |
Diploma or GED | 624 | 9033 | 32251 | |
Some College | 1715 | 12714 | 35543 | |
Assoc. Degree | 580 | 4389 | 13798 | |
Bachelors Degree | 3025 | 26492 | 64793 | |
Higher Degree | 1817 | 16242 | 38926 | |
Total Housing Units | 5,368 | 51,446 | 140,997 | |
--Owner-Occupied | 2,844 | 21,802 | 52,401 | |
--Renter-Occupied | 2,003 | 22,890 | 73,191 | |
Owner-Occupied Values | < 100K | 66 | 810 | 3328 |
100-199K | 566 | 3157 | 10933 | |
200-299K | 418 | 4504 | 10536 | |
300-399K | 198 | 4323 | 8462 | |
400-499K | 335 | 2211 | 4684 | |
500K+ | 1261 | 6797 | 14458 | |
Total Working Age Population | 9,758 | 84,451 | 239,406 | |
In Work Force | 6,704 | 58,692 | 166,151 | |
Not In Work Force | 3,055 | 25,759 | 73,256 | |
Workforce Employed | 6,430 | 56,148 | 156,785 | |
Workforce Unemployed | 273 | 2,538 | 8,975 | |
Civlian Workforce | 6,704 | 58,686 | 165,761 | |
Military Workforce | 0 | 6 | 390 | |
Total Households | 4,847 | 44,692 | 125,592 | |
Family Households | 3,371 | 27,919 | 75,194 | |
Non-Family Households | 1,475 | 16,773 | 50,397 | |
Married Couple | 2,537 | 20,945 | 52,140 | |
Other Family | 834 | 6,974 | 23,054 | |
Married w/Child | 1,478 | 10,029 | 22,882 | |
Single Male w/Child | 240 | 873 | 2,526 | |
Single Female w/Child | 304 | 3,128 | 9,480 |
Population Change Last Two Decades - Plus Projection
2000 | % | 2010 | % | 2020 | % | 2030 | |
---|---|---|---|---|---|---|---|
Texas | 20,851,820 | +21 | 25,145,561 | +18 | 29,677,668 | +18 | 34,894,452 |
Harris County | 3,400,578 | +20 | 4,092,459 | +22 | 4,978,845 | +19 | 5,924,750 |
Total Working Age Population:
Total Households:
Total Working Age Population:
Total Households:
Total Working Age Population:
Total Households: