Industrial Properties
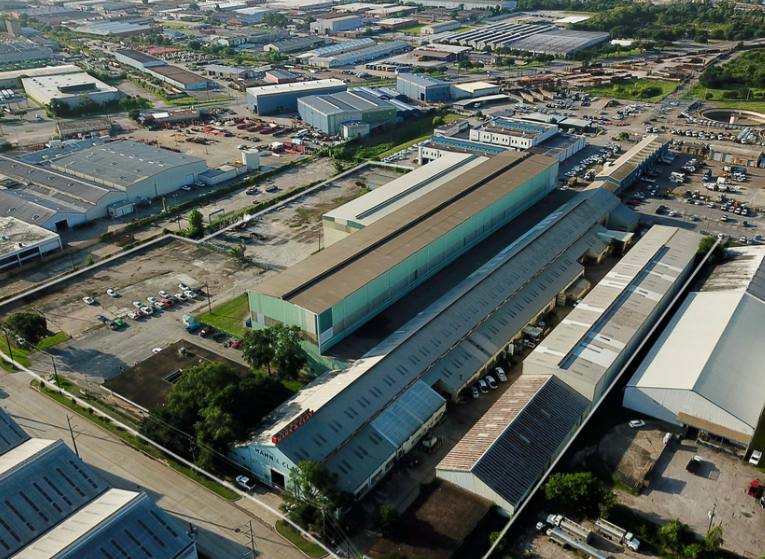
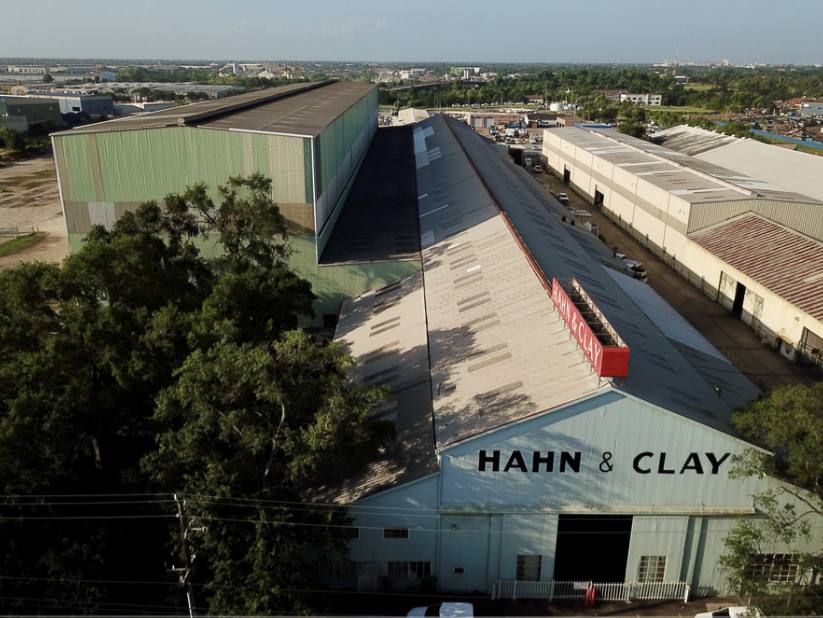
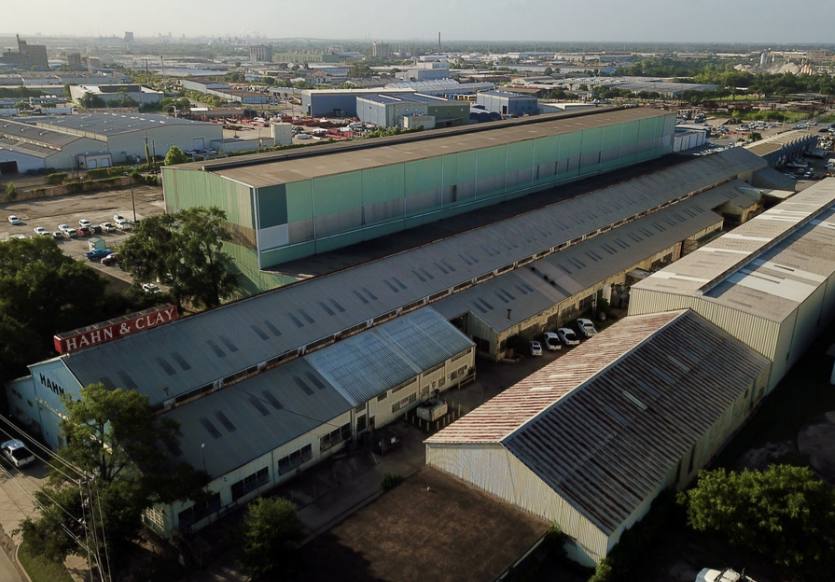
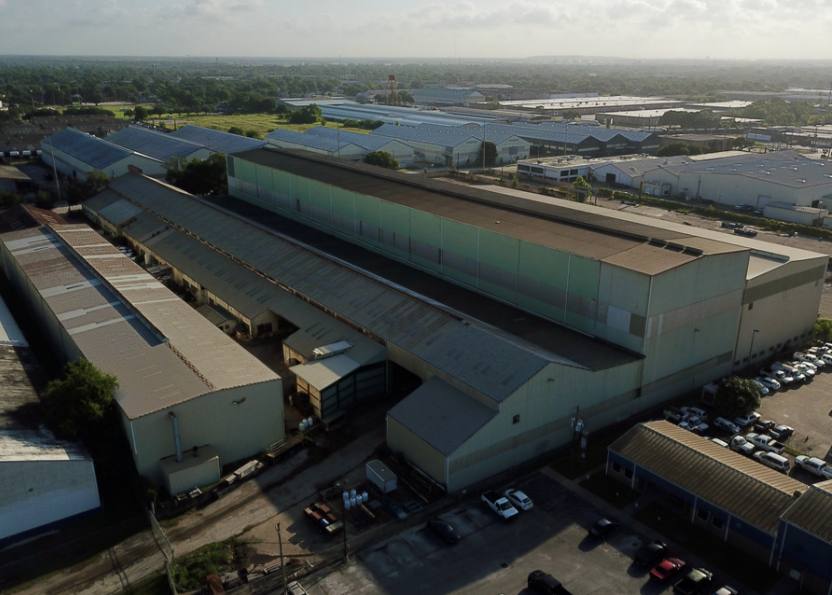
5100 Clinton Drive Houston, TX 77020
5100 Clinton Drive Houston, TX 77020
Details & Description
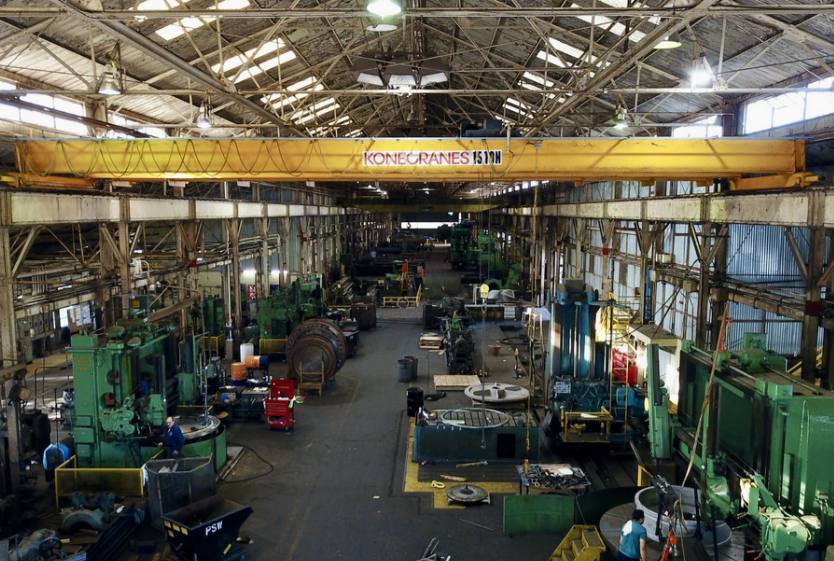
Property Highlights
- • Office Space 10,500 SF
- • Grade Level
- • 13 Cranes
- • Crane Weight Range: 1 - 200 Tons
- • Crane Clear Height: 26’ - 55’
- • Clean Environmental Report
Additional Photos

Listing Agents

Thomas Erwin
O: 713-773-5571
M: 713-516-0052
terwin@moodyrambinint.com
O: 713-773-5571
M: 713-516-0052
terwin@moodyrambinint.com

Doyle Toups
O: 713-773-5598
M: 281-460-1694
dtoups@moodyrambinint.com
O: 713-773-5598
M: 281-460-1694
dtoups@moodyrambinint.com

Davis Sheffield
O: 713-773-5500
M: 713-373-0423
dsheffield@moodyrambinint.com
O: 713-773-5500
M: 713-373-0423
dsheffield@moodyrambinint.com
While we strive to provide the most accurate information, all listing information, and demographic data, is provided by third-parties. As such, MyEListing will not be responsible for the accuracy of the information. It is strongly recommended that you verify all information with the listing agent, and any relevant agencies, prior to making any decisions.