Industrial Properties
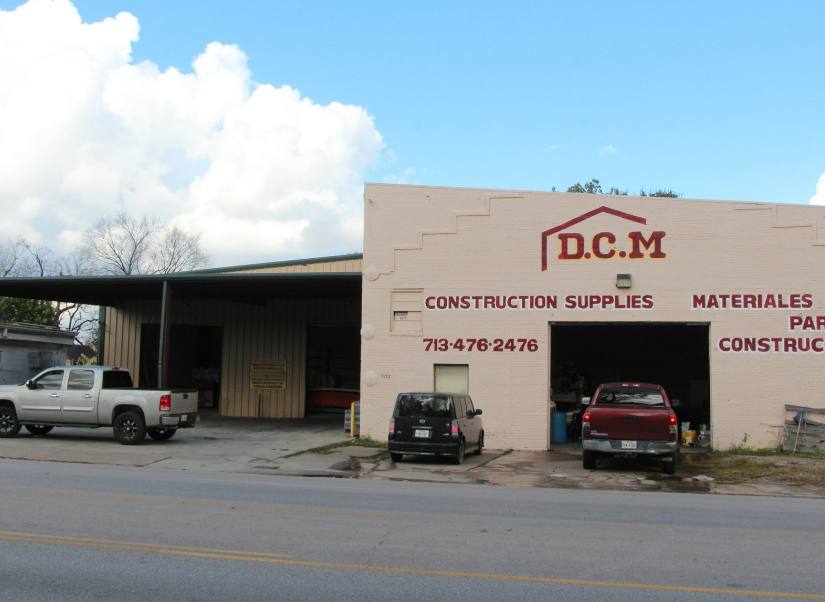
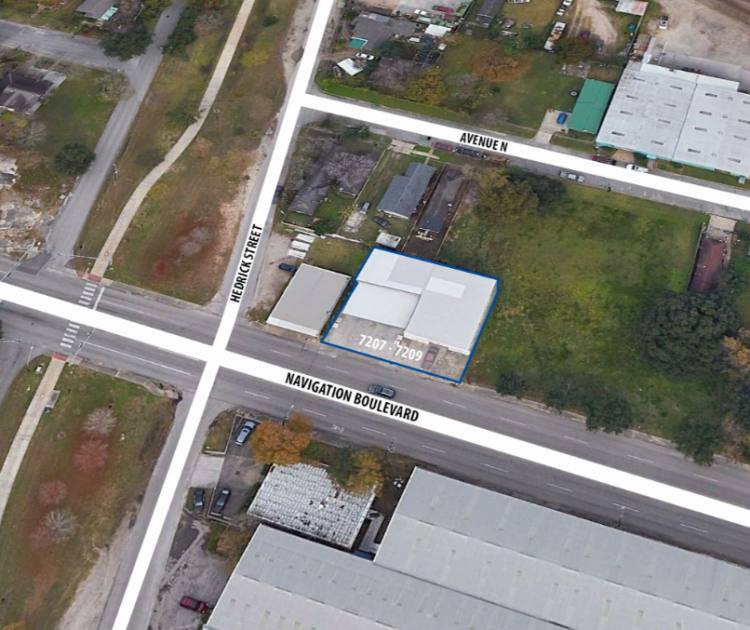
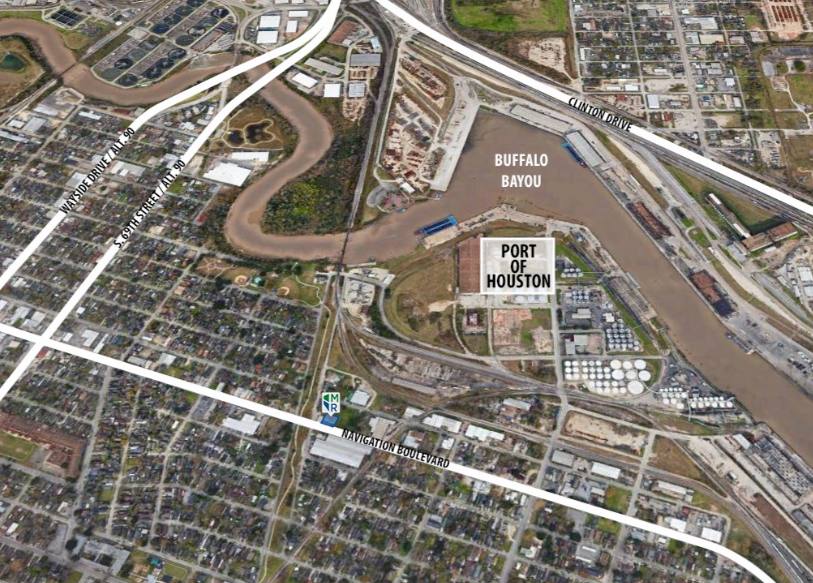
7207 Navigation Boulevard Houston, TX 77011
7207 Navigation Boulevard Houston, TX 77011
Details & Description
Property Highlights
- • Office Space 516 SF
- • Power: 3 Phase
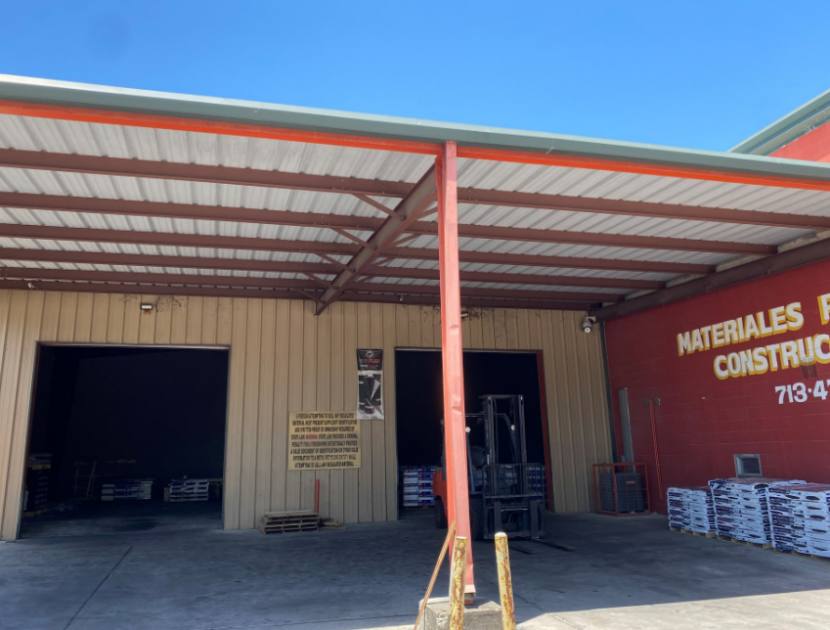
- • Concrete Block/Brick/ Metal Exterior
- • Multiple Cameras for Security
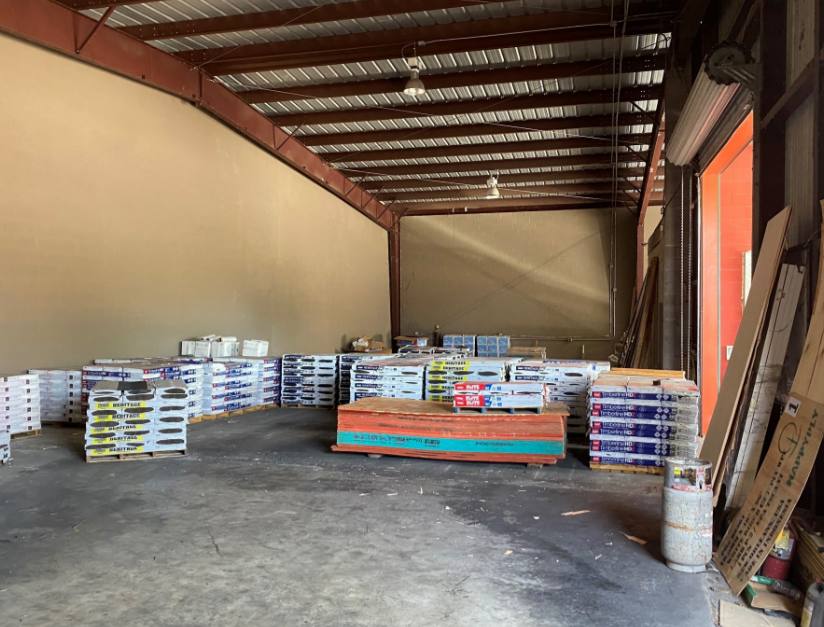
- • Clear Height: 18' - 22'
- • Clear Span Building
Additional Photos
Listing Agents

Davis Sheffield
O: 713-773-5500
M: 713-373-0423
dsheffield@moodyrambinint.com
O: 713-773-5500
M: 713-373-0423
dsheffield@moodyrambinint.com

Thomas Erwin
O: 713-773-5571
M: 713-516-0052
terwin@moodyrambinint.com
O: 713-773-5571
M: 713-516-0052
terwin@moodyrambinint.com
While we strive to provide the most accurate information, all listing information, and demographic data, is provided by third-parties. As such, MyEListing will not be responsible for the accuracy of the information. It is strongly recommended that you verify all information with the listing agent, and any relevant agencies, prior to making any decisions.


