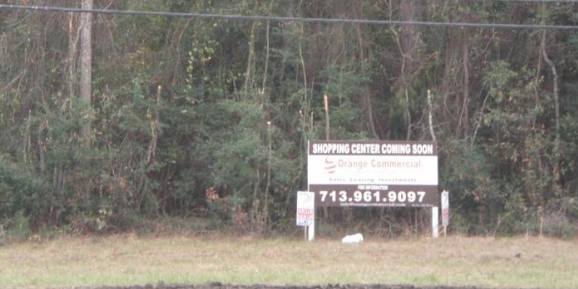
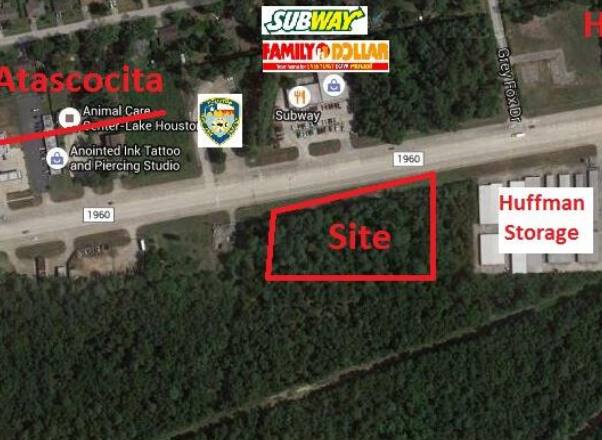
Commercial Land
11500 Block of FM 1960 Huffman, TX 77336
11500 Block of FM 1960 Huffman, TX 77336
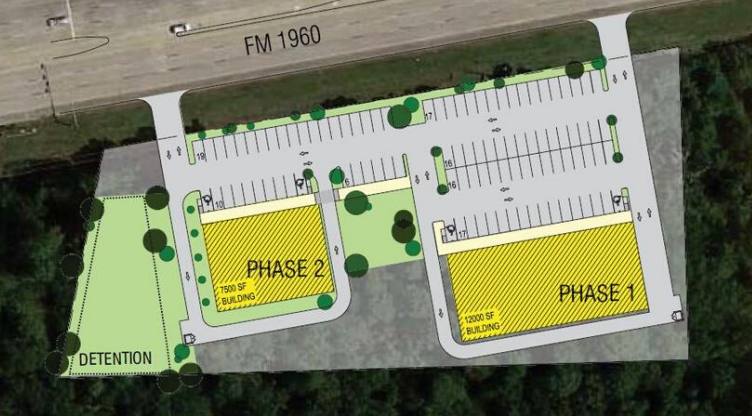
Details & Description
Property Highlights
- • 5 mile Population 61,586
- • Total Households 21,771
- • Median Home Values $229,479
- • Median Incomes $93,174
- • Cars Per Day on FM 1960 25,328
Listing Agents

Bill Wong
O: 713-961-9097
billw@orangecommercial.com
O: 713-961-9097
billw@orangecommercial.com
While we strive to provide the most accurate information, all listing information, and demographic data, is provided by third-parties. As such, MyEListing will not be responsible for the accuracy of the information. It is strongly recommended that you verify all information with the listing agent, and any relevant agencies, prior to making any decisions.